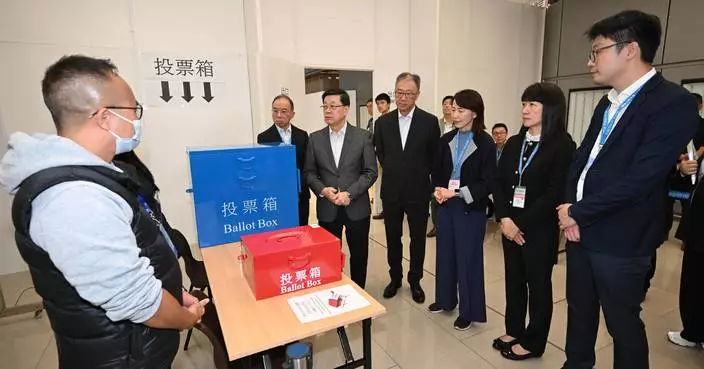
Legislative Council General Election voter turnout (1030)
The voter turnout figures for the 2025 Legislative Council General Election as at 10.30am today (December 7) are as follows:
Geographical constituencies
-------------------------------

Electorate |
Cumulative
voter
turnout |
Cumulative
turnout
rate (%) |
Hong Kong Island East |
379,926 |
27,797 |
7.32% |
Hong Kong Island West |
342,123 |
23,924 |
6.99% |
Kowloon East |
441,663 |
33,976 |
7.69% |
Kowloon West |
345,661 |
23,876 |
6.91% |
Kowloon Central |
421,235 |
30,459 |
7.23% |
New Territories South East |
439,546 |
30,682 |
6.98% |
New Territories North |
408,660 |
29,469 |
7.21% |
New Territories North West |
436,087 |
32,557 |
7.47% |
New Territories South West |
471,045 |
36,541 |
7.76% |
New Territories North East |
445,352 |
30,669 |
6.89% |
Total |
4,131,298 |
299,950 |
7.26% |
Functional constituencies
----------------------------
Electorate |
Cumulative
voter
turnout |
Cumulative
turnout
rate (%) |
Heung Yee Kuk |
155 |
53 |
34.19% |
Agriculture and fisheries |
172 |
96 |
55.81% |
Insurance |
111 |
33 |
29.73% |
Transport |
217 |
80 |
36.87% |
Education |
74,618 |
5,339 |
7.16% |
Legal |
6,328 |
497 |
7.85% |
Accountancy |
23,937 |
1,550 |
6.48% |
Medical and health services |
49,316 |
3,492 |
7.08% |
Engineering |
9,699 |
1,504 |
15.51% |
Architectural, surveying,
planning and landscape |
8,212 |
1,024 |
12.47% |
Labour |
881 |
452 |
51.31% |
Social welfare |
11,217 |
950 |
8.47% |
Real estate and construction |
557 |
125 |
22.44% |
Tourism |
173 |
58 |
33.53% |
Commercial (first) |
903 |
210 |
23.26% |
Commercial (second) |
323 |
78 |
24.15% |
Commercial (third) |
307 |
305 |
99.35% |
Industrial (first) |
345 |
85 |
24.64% |
Industrial (second) |
474 |
81 |
17.09% |
Finance |
91 |
26 |
28.57% |
Financial services |
562 |
121 |
21.53% |
Sports, performing arts,
culture and publication |
255 |
79 |
30.98% |
Import and export |
311 |
97 |
31.19% |
Textiles and garment |
322 |
66 |
20.50% |
Wholesale and retail |
1,673 |
238 |
14.23% |
Technology and innovation |
71 |
47 |
66.20% |
Catering |
129 |
45 |
34.88% |
Hong Kong Special
Administrative Region
deputies to the National
People's Congress, Hong
Kong Special
Administrative Region
members of the National
Committee of the Chinese
People's Political
Consultative Conference
and representatives of
relevant national
organisations |
557 |
332 |
59.61% |
Total |
191,916 |
17,063 |
8.89% |
Election Committee constituency
-------------------------------------
Electorate |
Cumulative voter turnout |
Cumulative turnout
rate (%) |
1,466 |
900 |
61.39% |
The voter turnout figures are for temporary reference only.
Source: AI-found images
Legislative Council General Election voter turnout (0930)
The voter turnout figures for the 2025 Legislative Council General Election as at 9.30am today (December 7) are as follows:
Geographical constituencies
-------------------------------

Electorate |
Cumulative
voter
turnout |
Cumulative
turnout
rate (%) |
Hong Kong Island East |
379,926 |
16,051 |
4.22% |
Hong Kong Island West |
342,123 |
13,870 |
4.05% |
Kowloon East |
441,663 |
19,472 |
4.41% |
Kowloon West |
345,661 |
13,725 |
3.97% |
Kowloon Central |
421,235 |
17,596 |
4.18% |
New Territories South East |
439,546 |
17,522 |
3.99% |
New Territories North |
408,660 |
16,756 |
4.10% |
New Territories North West |
436,087 |
18,832 |
4.32% |
New Territories South West |
471,045 |
21,134 |
4.49% |
New Territories North East |
445,352 |
17,579 |
3.95% |
Total |
4,131,298 |
172,537 |
4.18% |
Functional constituencies
----------------------------
Electorate |
Cumulative
voter
turnout |
Cumulative
turnout
rate (%) |
Heung Yee Kuk |
155 |
33 |
21.29% |
Agriculture and fisheries |
172 |
61 |
35.47% |
Insurance |
111 |
23 |
20.72% |
Transport |
217 |
55 |
25.35% |
Education |
74,618 |
3,248 |
4.35% |
Legal |
6,328 |
293 |
4.63% |
Accountancy |
23,937 |
913 |
3.81% |
Medical and health services |
49,316 |
2,051 |
4.16% |
Engineering |
9,699 |
961 |
9.91% |
Architectural, surveying,
planning and landscape |
8,212 |
638 |
7.77% |
Labour |
881 |
346 |
39.27% |
Social welfare |
11,217 |
581 |
5.18% |
Real estate and construction |
557 |
69 |
12.39% |
Tourism |
173 |
35 |
20.23% |
Commercial (first) |
903 |
126 |
13.95% |
Commercial (second) |
323 |
44 |
13.62% |
Commercial (third) |
307 |
295 |
96.09% |
Industrial (first) |
345 |
45 |
13.04% |
Industrial (second) |
474 |
44 |
9.28% |
Finance |
91 |
22 |
24.18% |
Financial services |
562 |
76 |
13.52% |
Sports, performing arts,
culture and publication |
255 |
48 |
18.82% |
Import and export |
311 |
54 |
17.36% |
Textiles and garment |
322 |
34 |
10.56% |
Wholesale and retail |
1,673 |
142 |
8.49% |
Technology and innovation |
71 |
30 |
42.25% |
Catering |
129 |
31 |
24.03% |
Hong Kong Special
Administrative Region
deputies to the National
People's Congress, Hong
Kong Special
Administrative Region
members of the National
Committee of the Chinese
People's Political
Consultative Conference
and representatives of
relevant national
organisations |
557 |
196 |
35.19% |
Total |
191,916 |
10,494 |
5.47% |
Election Committee constituency
-------------------------------------
Electorate |
Cumulative voter turnout |
Cumulative turnout
rate (%) |
1,466 |
540 |
36.83% |
The voter turnout figures are for temporary reference only.
Source: AI-found images