
| MEDTRONIC PLC WORLD WIDE REVENUE(1) (Unaudited) | ||||||||||||||||||||||||||||
| THIRD QUARTER | YEAR-TO-DATE | |||||||||||||||||||||||||||
| REPORTED | ORGANIC | REPORTED | ORGANIC | |||||||||||||||||||||||||
| (in millions) | FY26 | FY25 | Growth | Currency | FY26(5) | FY25(5) | Growth | FY26 | FY25 | Growth | Currency | FY26(6) | FY25(6) | Growth | ||||||||||||||
| Cardiovascular | $ 3,457 | $ 3,037 | 13.8 % | $ 99 | $ 3,359 | $ 3,037 | 10.6 % | $ 10,179 | $ 9,145 | 11.3 % | $ 213 | $ 9,966 | $ 9,145 | 9.0 % | ||||||||||||||
| Cardiac Rhythm & Heart Failure | 1,856 | 1,545 | 20.1 | 48 | 1,808 | 1,545 | 17.0 | 5,394 | 4,659 | 15.8 | 107 | 5,287 | 4,659 | 13.5 | ||||||||||||||
| Structural Heart & Aortic | 929 | 874 | 6.3 | 32 | 897 | 874 | 2.6 | 2,814 | 2,610 | 7.8 | 71 | 2,743 | 2,610 | 5.1 | ||||||||||||||
| Coronary & Peripheral Vascular | 672 | 618 | 8.8 | 18 | 654 | 618 | 5.9 | 1,971 | 1,876 | 5.0 | 35 | 1,935 | 1,876 | 3.1 | ||||||||||||||
| Neuroscience | 2,558 | 2,458 | 4.1 | 38 | 2,520 | 2,458 | 2.5 | 7,536 | 7,226 | 4.3 | 81 | 7,455 | 7,226 | 3.2 | ||||||||||||||
| Cranial & Spinal Technologies | 1,310 | 1,250 | 4.8 | 13 | 1,296 | 1,250 | 3.7 | 3,819 | 3,632 | 5.1 | 31 | 3,788 | 3,632 | 4.3 | ||||||||||||||
| Specialty Therapies | 746 | 732 | 1.9 | 15 | 731 | 732 | (0.2) | 2,191 | 2,181 | 0.4 | 28 | 2,163 | 2,181 | (0.8) | ||||||||||||||
| Neuromodulation | 503 | 476 | 5.8 | 10 | 493 | 476 | 3.6 | 1,527 | 1,413 | 8.1 | 22 | 1,504 | 1,413 | 6.5 | ||||||||||||||
| Medical Surgical | 2,173 | 2,072 | 4.9 | 61 | 2,112 | 2,057 | 2.7 | 6,428 | 6,196 | 3.7 | 128 | 6,295 | 6,164 | 2.1 | ||||||||||||||
| Surgical & Endoscopy | 1,654 | 1,596 | 3.6 | 51 | 1,603 | 1,581 | 1.4 | 4,945 | 4,790 | 3.2 | 106 | 4,834 | 4,758 | 1.6 | ||||||||||||||
| Acute Care & Monitoring | 519 | 476 | 9.1 | 10 | 509 | 476 | 7.0 | 1,483 | 1,406 | 5.5 | 22 | 1,461 | 1,406 | 3.9 | ||||||||||||||
| Diabetes | 796 | 694 | 14.8 | 44 | 751 | 694 | 8.3 | 2,274 | 2,027 | 12.2 | 90 | 2,184 | 2,027 | 7.8 | ||||||||||||||
| Total Reportable Segments | 8,985 | 8,260 | 8.8 | 242 | 8,743 | 8,245 | 6.0 | 26,417 | 24,593 | 7.4 | 512 | 25,901 | 24,562 | 5.4 | ||||||||||||||
| Other(2) | 32 | 32 | 3.0 | — | — | — | — | 140 | 17 | NM(3) | 4 | — | — | — | ||||||||||||||
| TOTAL | $ 9,017 | $ 8,292 | 8.7 % | $ 243 | $ 8,743 | $ 8,245 | 6.0 % | $ 26,557 | $ 24,610 | 7.9 % | $ 516 | $ 25,901 | $ 24,562 | 5.4 % | ||||||||||||||
| See description of non-GAAP financial measures contained in the press release dated February 17, 2026. | |
| (1) | The data in this schedule has been intentionally rounded to the nearest million and, therefore, may not sum. Percentages have been calculated using actual, non-rounded figures and, therefore, may not recalculate precisely. |
| (2) | Includes the historical operations and ongoing transition agreements from businesses the Company has exited or divested, and for the year-to-date figures, adjustments to the Company's Italian payback accruals resulting from the two July 22, 2024 rulings by the Constitutional Court and the Legislative Decree published by the Italian government on June 30, 2025 for certain prior years since 2015. |
| (3) | Not meaningful (NM). |
| (4) | The currency impact to revenue measures the change in revenue between current and prior year periods using constant exchange rates. |
| (5) | The three months ended January 23, 2026 excludes $275 million of revenue adjustments, including $32 million of inorganic revenue for the transition activity noted in (2) and $242 million of favorable currency impact on the remaining segments. The three months ended January 24, 2025 excludes $47 million of revenue adjustments, including $32 million of inorganic revenue related to the transition activity noted in (2) and $15 million of inorganic revenue related to a sale of business in the Surgical and Endoscopy division. |
| (6) | The nine months ended January 23, 2026 excludes $656 million of revenue adjustments, including $39 million reduction in the Italian payback accruals due to changes in estimates further described in note (2), $101 million of inorganic revenue for the transition activity noted in (2), $5 million of inorganic revenue related to a sale of business in the Surgical and Endoscopy division, and $512 million of favorable currency impact on the remaining segments. The nine months ended January 24, 2025 excludes $48 million of revenue adjustments, including $90 million of incremental Italian payback accruals further described in note (2), $106 million of inorganic revenue related to the transition activity noted in (2), and $31 million of inorganic revenue related to a sale of business in the Surgical and Endoscopy division. |
| MEDTRONIC PLC U.S. REVENUE(1)(2) (Unaudited) | ||||||||||||||||||||||||
| THIRD QUARTER | YEAR-TO-DATE | |||||||||||||||||||||||
| REPORTED | ORGANIC | REPORTED | ORGANIC | |||||||||||||||||||||
| (in millions) | FY26 | FY25 | Growth | FY26 | FY25 | Growth | FY26 | FY25 | Growth | FY26 | FY25 | Growth | ||||||||||||
| Cardiovascular | $ 1,589 | $ 1,405 | 13.1 % | $ 1,589 | $ 1,405 | 13.1 % | $ 4,660 | $ 4,242 | 9.9 % | $ 4,660 | $ 4,242 | 9.9 % | ||||||||||||
| Cardiac Rhythm & Heart Failure | 953 | 775 | 23.0 | 953 | 775 | 23.0 | 2,708 | 2,309 | 17.3 | 2,708 | 2,309 | 17.3 | ||||||||||||
| Structural Heart & Aortic | 367 | 372 | (1.4) | 367 | 372 | (1.4) | 1,128 | 1,129 | — | 1,128 | 1,129 | — | ||||||||||||
| Coronary & Peripheral Vascular | 269 | 258 | 4.2 | 269 | 258 | 4.2 | 824 | 804 | 2.5 | 824 | 804 | 2.5 | ||||||||||||
| Neuroscience | 1,709 | 1,689 | 1.2 | 1,709 | 1,689 | 1.2 | 5,063 | 4,931 | 2.7 | 5,063 | 4,931 | 2.7 | ||||||||||||
| Cranial & Spinal Technologies | 977 | 943 | 3.6 | 977 | 943 | 3.6 | 2,833 | 2,724 | 4.0 | 2,833 | 2,724 | 4.0 | ||||||||||||
| Specialty Therapies | 402 | 419 | (4.0) | 402 | 419 | (4.0) | 1,204 | 1,235 | (2.5) | 1,204 | 1,235 | (2.5) | ||||||||||||
| Neuromodulation | 330 | 327 | 1.1 | 330 | 327 | 1.1 | 1,026 | 972 | 5.6 | 1,026 | 972 | 5.6 | ||||||||||||
| Medical Surgical | 929 | 893 | 4.1 | 929 | 893 | 4.1 | 2,756 | 2,718 | 1.4 | 2,756 | 2,718 | 1.4 | ||||||||||||
| Surgical & Endoscopy | 634 | 623 | 1.7 | 634 | 623 | 1.7 | 1,920 | 1,928 | (0.4) | 1,920 | 1,928 | (0.4) | ||||||||||||
| Acute Care & Monitoring | 295 | 269 | 9.5 | 295 | 269 | 9.5 | 836 | 790 | 5.8 | 836 | 790 | 5.8 | ||||||||||||
| Diabetes | 248 | 236 | 4.9 | 248 | 236 | 4.9 | 695 | 683 | 1.7 | 695 | 683 | 1.7 | ||||||||||||
| Total Reportable Segments | 4,475 | 4,223 | 6.0 | 4,475 | 4,223 | 6.0 | 13,174 | 12,573 | 4.8 | 13,174 | 12,573 | 4.8 | ||||||||||||
| Other(3) | 18 | 15 | 23.4 | — | — | — | 60 | 51 | 16.8 | — | — | — | ||||||||||||
| TOTAL | $ 4,493 | $ 4,237 | 6.0 % | $ 4,475 | $ 4,223 | 6.0 % | $ 13,234 | $ 12,624 | 4.8 % | $ 13,174 | $ 12,573 | 4.8 % | ||||||||||||
| See description of non-GAAP financial measures contained in the press release dated February 17, 2026. | |
| (1) | U.S. includes the United States and U.S. territories. |
| (2) | The data in this schedule has been intentionally rounded to the nearest million and, therefore, may not sum. Percentages have been calculated using actual, non-rounded figures and, therefore, may not recalculate precisely. |
| (3) | Includes historical operations and ongoing transition agreements from businesses the Company has exited or divested. |
| MEDTRONIC PLC INTERNATIONAL REVENUE(1) (Unaudited) | ||||||||||||||||||||||||||||
| THIRD QUARTER | YEAR-TO-DATE | |||||||||||||||||||||||||||
| REPORTED | ORGANIC | REPORTED | ORGANIC | |||||||||||||||||||||||||
| (in millions) | FY26 | FY25 | Growth | Currency | FY26(5) | FY25(5) | Growth | FY26 | FY25 | Growth | Currency | FY26(6) | FY25(6) | Growth | ||||||||||||||
| Cardiovascular | $ 1,868 | $ 1,632 | 14.5 % | $ 99 | $ 1,770 | $ 1,632 | 8.5 % | $ 5,519 | $ 4,904 | 12.5 % | $ 213 | $ 5,306 | $ 4,904 | 8.2 % | ||||||||||||||
| Cardiac Rhythm & Heart Failure | 903 | 770 | 17.3 | 48 | 855 | 770 | 11.0 | 2,686 | 2,350 | 14.3 | 107 | 2,580 | 2,350 | 9.8 | ||||||||||||||
| Structural Heart & Aortic | 562 | 502 | 12.0 | 32 | 530 | 502 | 5.5 | 1,686 | 1,482 | 13.8 | 71 | 1,615 | 1,482 | 9.0 | ||||||||||||||
| Coronary & Peripheral Vascular | 403 | 360 | 12.2 | 18 | 385 | 360 | 7.1 | 1,146 | 1,072 | 6.9 | 35 | 1,111 | 1,072 | 3.6 | ||||||||||||||
| Neuroscience | 849 | 769 | 10.4 | 38 | 811 | 769 | 5.4 | 2,474 | 2,295 | 7.8 | 81 | 2,392 | 2,295 | 4.2 | ||||||||||||||
| Cranial & Spinal Technologies | 333 | 307 | 8.4 | 13 | 320 | 307 | 4.1 | 985 | 907 | 8.6 | 31 | 955 | 907 | 5.2 | ||||||||||||||
| Specialty Therapies | 343 | 313 | 9.7 | 15 | 328 | 313 | 5.0 | 987 | 947 | 4.3 | 28 | 959 | 947 | 1.3 | ||||||||||||||
| Neuromodulation | 173 | 149 | 16.0 | 10 | 163 | 149 | 9.1 | 501 | 441 | 13.5 | 22 | 478 | 441 | 8.4 | ||||||||||||||
| Medical Surgical | 1,244 | 1,180 | 5.5 | 61 | 1,183 | 1,165 | 1.6 | 3,671 | 3,478 | 5.6 | 128 | 3,539 | 3,447 | 2.7 | ||||||||||||||
| Surgical & Endoscopy | 1,020 | 973 | 4.8 | 51 | 969 | 958 | 1.1 | 3,024 | 2,862 | 5.7 | 106 | 2,914 | 2,831 | 2.9 | ||||||||||||||
| Acute Care & Monitoring | 224 | 206 | 8.5 | 10 | 214 | 206 | 3.8 | 647 | 616 | 5.0 | 22 | 625 | 616 | 1.4 | ||||||||||||||
| Diabetes | 548 | 457 | 19.8 | 44 | 504 | 457 | 10.1 | 1,579 | 1,344 | 17.5 | 90 | 1,489 | 1,344 | 10.9 | ||||||||||||||
| Total Reportable Segments | 4,510 | 4,038 | 11.7 | 242 | 4,267 | 4,023 | 6.1 | 13,243 | 12,020 | 10.2 | 512 | 12,726 | 11,989 | 6.2 | ||||||||||||||
| Other(2) | 14 | 17 | (14.6) | — | — | — | — | 80 | (35) | NM(3) | 4 | — | — | — | ||||||||||||||
| TOTAL | $ 4,524 | $ 4,055 | 11.6 % | $ 243 | $ 4,267 | $ 4,023 | 6.1 % | $ 13,323 | $ 11,986 | 11.2 % | $ 516 | $ 12,726 | $ 11,989 | 6.2 % | ||||||||||||||
| See description of non-GAAP financial measures contained in the press release dated February 17, 2026. | |
| (1) | The data in this schedule has been intentionally rounded to the nearest million and, therefore, may not sum. Percentages have been calculated using actual, non-rounded figures and, therefore, may not recalculate precisely. |
| (2) | Includes the historical operations and ongoing transition agreements from businesses the Company has exited or divested, and for the year-to-date figures, adjustments to the Company's Italian payback accruals resulting from the two July 22, 2024 rulings by the Constitutional Court and the Legislative Decree published by the Italian government on June 30, 2025 for certain prior years since 2015. |
| (3) | Not meaningful (NM). |
| (4) | The currency impact to revenue measures the change in revenue between current and prior year periods using constant exchange rates. |
| (5) | The three months ended January 23, 2026 excludes $257 million of revenue adjustments, including $14 million of inorganic revenue for the transition activity noted in (2) and $242 million of favorable currency impact on the remaining segments. The three months ended January 24, 2025 excludes $32 million of revenue adjustments, including $17 million of inorganic revenue related to the transition activity noted in (2) and $15 million of inorganic revenue related to a sale of business in the Surgical and Endoscopy division. |
| (6) | The nine months ended January 23, 2026 excludes $597 million of revenue adjustments, including $39 million reduction in the Italian payback accruals due to changes in estimates further described in note (2), $41 million of inorganic revenue for the transition activity noted in (2), $5 million of inorganic revenue related to a sale of business in the Surgical and Endoscopy division, and $512 million of favorable currency impact on the remaining segments. The nine months ended January 24, 2025 excludes $3 million of revenue adjustments, including $90 million of incremental Italian payback accruals further described in note (2), $55 million of inorganic revenue related to the transition activity noted in (2), and $31 million of inorganic revenue related to a sale of business in the Surgical and Endoscopy division. |
| MEDTRONIC PLC CONSOLIDATED STATEMENTS OF INCOME (Unaudited) | |||||||
| Three months ended | Nine months ended | ||||||
| (in millions, except per share data) | January 23, 2026 | January 24, 2025 | January 23, 2026 | January 24, 2025 | |||
| Net sales | $ 9,017 | $ 8,292 | $ 26,557 | $ 24,610 | |||
| Costs and expenses: | |||||||
| Cost of products sold, excluding amortization of intangible assets | 3,261 | 2,779 | 9,323 | 8,485 | |||
| Research and development expense | 722 | 675 | 2,202 | 2,048 | |||
| Selling, general, and administrative expense | 2,956 | 2,717 | 8,727 | 8,129 | |||
| Amortization of intangible assets | 441 | 416 | 1,364 | 1,243 | |||
| Restructuring charges, net | 77 | 43 | 131 | 120 | |||
| Certain litigation charges, net | 62 | 22 | 89 | 104 | |||
| Other operating expense (income), net | 35 | (5) | 126 | (38) | |||
| Operating profit | 1,464 | 1,646 | 4,594 | 4,519 | |||
| Other non-operating income, net | (121) | (72) | (247) | (403) | |||
| Interest expense, net | 181 | 179 | 539 | 555 | |||
| Income before income taxes | 1,404 | 1,540 | 4,302 | 4,367 | |||
| Income tax provision | 254 | 237 | 724 | 737 | |||
| Net income | 1,150 | 1,303 | 3,578 | 3,630 | |||
| Net income attributable to noncontrolling interests | (6) | (9) | (21) | (24) | |||
| Net income attributable to Medtronic | $ 1,143 | $ 1,294 | $ 3,557 | $ 3,606 | |||
| Basic earnings per share | $ 0.89 | $ 1.01 | $ 2.77 | $ 2.80 | |||
| Diluted earnings per share | $ 0.89 | $ 1.01 | $ 2.76 | $ 2.79 | |||
| Basic weighted average shares outstanding | 1,282.6 | 1,282.4 | 1,282.1 | 1,286.7 | |||
| Diluted weighted average shares outstanding | 1,289.5 | 1,286.2 | 1,288.2 | 1,290.6 | |||
| The data in the schedule above has been intentionally rounded to the nearest million. |
| MEDTRONIC PLC GAAP TO NON-GAAP RECONCILIATIONS(1) (Unaudited) | |||||||||||||||||
| Three months ended January 23, 2026 | |||||||||||||||||
| (in millions, except per share data) | Net | Cost of | Gross | Operating | Operating | Income | Net Income | Diluted | Effective | ||||||||
| GAAP | $ 9,017 | $ 3,261 | 63.8 % | $ 1,464 | 16.2 % | $ 1,404 | $ 1,143 | $ 0.89 | 18.1 % | ||||||||
| Non-GAAP Adjustments: | |||||||||||||||||
| Amortization of intangible assets(2) | — | — | — | 441 | 4.9 | 441 | 360 | 0.28 | 18.4 | ||||||||
| Restructuring and associated costs(3) | — | (89) | 1.0 | 172 | 1.9 | 172 | 141 | 0.11 | 18.0 | ||||||||
| Acquisition and divestiture-related items(4) | — | (6) | 0.1 | 38 | 0.4 | 38 | 33 | 0.03 | 13.2 | ||||||||
| Certain litigation charges, net | — | — | — | 62 | 0.7 | 62 | 52 | 0.04 | 16.1 | ||||||||
| (Gain)/loss on minority investments(5) | — | — | — | — | — | 8 | 7 | 0.01 | 12.5 | ||||||||
| Certain tax adjustments, net | — | — | — | — | — | — | 14 | 0.01 | — | ||||||||
| Non-GAAP | $ 9,017 | $ 3,166 | 64.9 % | $ 2,177 | 24.1 % | $ 2,125 | $ 1,750 | $ 1.36 | 17.3 % | ||||||||
| Currency impact | (243) | (52) | (0.4) | (67) | (0.1) | (0.04) | |||||||||||
| Currency Adjusted | $ 8,775 | $ 3,114 | 64.5 % | $ 2,110 | 24.0 % | $ 1.32 | |||||||||||
| Three months ended January 24, 2025 | |||||||||||||||||
| (in millions, except per share data) | Net | Cost of | Gross | Operating | Operating | Income | Net Income | Diluted | Effective | ||||||||
| GAAP | $ 8,292 | $ 2,779 | 66.5 % | $ 1,646 | 19.9 % | $ 1,540 | $ 1,294 | $ 1.01 | 15.4 % | ||||||||
| Non-GAAP Adjustments: | |||||||||||||||||
| Amortization of intangible assets | — | — | — | 416 | 5.0 | 416 | 339 | 0.26 | 18.5 | ||||||||
| Restructuring and associated costs(3) | — | (4) | — | 46 | 0.6 | 46 | 37 | 0.03 | 19.6 | ||||||||
| Acquisition and divestiture-related items(4) | — | (1) | — | 28 | 0.3 | 28 | 23 | 0.02 | 17.9 | ||||||||
| Certain litigation charges, net | — | — | — | 22 | 0.3 | 22 | 18 | 0.01 | 22.7 | ||||||||
| (Gain)/loss on minority investments(5) | — | — | — | — | — | 68 | 52 | 0.04 | 22.1 | ||||||||
| Medical device regulations(6) | — | (8) | 0.1 | 11 | 0.1 | 11 | 9 | 0.01 | 18.2 | ||||||||
| Certain tax adjustments, net | — | — | — | — | — | — | 15 | 0.01 | — | ||||||||
| Non-GAAP | $ 8,292 | $ 2,766 | 66.6 % | $ 2,169 | 26.2 % | $ 2,130 | $ 1,787 | $ 1.39 | 15.7 % | ||||||||
| See description of non-GAAP financial measures contained in the press release dated February 17, 2026. | |
| (1) | The data in this schedule has been intentionally rounded to the nearest million or $0.01 for EPS figures, and, therefore, may not sum. |
| (2) | The Company recognized $30 million of accelerated amortization on certain intangible assets within the Cardiovascular Portfolio. |
| (3) | The charges primarily relate to employee termination benefits, facility related and contract termination costs, and asset write offs. |
| (4) | The charges primarily include business combination costs, changes in fair value of contingent consideration, exit of business-related charges, and gains related to certain business or asset sales. Exit of business-related charges primarily relate to the impending separation of the Diabetes business. For the three months ended January 23, 2026, charges also include costs associated with the Company's June 2021 decision to stop the distribution and sale of the Medtronic HVAD System. |
| (5) | We exclude unrealized and realized gains and losses on our minority investments as we do not believe that these components of income or expense have a direct correlation to our ongoing or future business operations. |
| (6) | The charges represent incremental costs of complying with the new European Union (E.U.) medical device regulations for previously registered products and primarily include charges for contractors supporting the project and other direct third-party expenses. We consider these costs to be duplicative of previously incurred costs and/or one-time costs. |
| MEDTRONIC PLC GAAP TO NON-GAAP RECONCILIATIONS(1) (Unaudited) | |||||||||||||||||
| Nine months ended January 23, 2026 | |||||||||||||||||
| (in millions, except per share data) | Net | Cost of | Gross | Operating | Operating | Income | Net Income | Diluted | Effective | ||||||||
| GAAP | $ 26,557 | $ 9,323 | 64.9 % | $ 4,594 | 17.3 % | $ 4,302 | $ 3,557 | $ 2.76 | 16.8 % | ||||||||
| Non-GAAP Adjustments: | |||||||||||||||||
| Amortization of intangible assets(2) | — | — | — | 1,364 | 5.2 | 1,364 | 1,110 | 0.86 | 18.6 | ||||||||
| Restructuring and associated costs(3) | — | (105) | 0.4 | 251 | 1.0 | 251 | 202 | 0.16 | 19.5 | ||||||||
| Acquisition and divestiture-related items(4) | — | (21) | — | 96 | 0.4 | 96 | 73 | 0.06 | 24.0 | ||||||||
| Certain litigation charges, net | — | — | — | 89 | 0.3 | 89 | 73 | 0.06 | 19.1 | ||||||||
| (Gain)/loss on minority investments(5) | — | — | — | — | — | 145 | 137 | 0.11 | 5.5 | ||||||||
| Other(6) | (39) | — | — | (39) | (0.1) | (39) | (30) | (0.02) | 20.5 | ||||||||
| Certain tax adjustments, net(7) | — | — | — | — | — | — | — | — | — | ||||||||
| Non-GAAP | $ 26,518 | $ 9,197 | 65.3 % | $ 6,356 | 24.0 % | $ 6,209 | $ 5,122 | $ 3.98 | 17.2 % | ||||||||
| Currency impact | (513) | (48) | (0.5) | (170) | (0.2) | (0.10) | |||||||||||
| Currency Adjusted | $ 26,005 | $ 9,149 | 64.8 % | $ 6,185 | 23.8 % | $ 3.88 | |||||||||||
| Nine months ended January 24, 2025 | |||||||||||||||||
| (in millions, except per share data) | Net | Cost of | Gross | Operating | Operating | Income | Net Income | Diluted | Effective | ||||||||
| GAAP | $ 24,610 | $ 8,485 | 65.5 % | $ 4,519 | 18.4 % | $ 4,367 | $ 3,606 | $ 2.79 | 16.9 % | ||||||||
| Non-GAAP Adjustments: | |||||||||||||||||
| Amortization of intangible assets | — | — | — | 1,243 | 4.9 | 1,243 | 1,017 | 0.79 | 18.3 | ||||||||
| Restructuring and associated costs(3) | — | (24) | 0.1 | 154 | 0.6 | 154 | 124 | 0.10 | 19.5 | ||||||||
| Acquisition and divestiture-related items(4) | — | (17) | — | 15 | 0.1 | 15 | 3 | — | 73.3 | ||||||||
| Certain litigation charges, net | — | — | — | 104 | 0.4 | 104 | 86 | 0.07 | 17.3 | ||||||||
| (Gain)/loss on minority investments(5) | — | — | — | — | — | 41 | 14 | 0.01 | 61.0 | ||||||||
| Medical device regulations(8) | — | (27) | 0.1 | 38 | 0.2 | 38 | 30 | 0.02 | 21.1 | ||||||||
| Other(6) | 90 | — | 0.2 | 90 | 0.4 | 90 | 70 | 0.05 | 22.2 | ||||||||
| Certain tax adjustments, net(7) | — | — | — | — | — | — | 49 | 0.04 | — | ||||||||
| Non-GAAP | $ 24,700 | $ 8,417 | 65.9 % | $ 6,162 | 24.9 % | $ 6,051 | $ 4,999 | $ 3.87 | 17.0 % | ||||||||
| See description of non-GAAP financial measures contained in the press release dated February 17, 2026. | |
| (1) | The data in this schedule has been intentionally rounded to the nearest million or $0.01 for EPS figures, and, therefore, may not sum. |
| (2) | The Company recognized $121 million of accelerated amortization on certain intangible assets within the Cardiovascular Portfolio. |
| (3) | The charges primarily relate to employee termination benefits, facility related and contract termination costs, and asset write offs. |
| (4) | The charges primarily include business combination costs, changes in fair value of contingent consideration, exit of business-related charges, and gains related to certain business or asset sales. Exit of business-related charges primarily relate to the impending separation of the Diabetes business and costs associated with the Company's June 2021 decision to stop the distribution and sale of the Medtronic HVAD System. |
| (5) | We exclude unrealized and realized gains and losses on our minority investments as we do not believe that these components of income or expense have a direct correlation to our ongoing or future business operations. |
| (6) | Reflects adjustments to the Company's Italian payback accruals resulting from the two July 22, 2024 rulings by the Constitutional Court and the Legislative Decree published by the Italian government on June 30, 2025 for certain prior years since 2015. |
| (7) | The charges for the nine months ended January 23, 2026 primarily includes a tax benefit recognized due to a change in interest accrued on uncertain tax positions, offset by amortization of previously established deferred tax assets arising from intercompany intellectual property transactions. The charges for the nine months ended January 24, 2025 primarily includes amortization of previously established deferred tax assets arising from intercompany intellectual property transactions. |
| (8) | The charges represent incremental costs of complying with the new European Union (E.U.) medical device regulations for previously registered products and primarily include charges for contractors supporting the project and other direct third-party expenses. We consider these costs to be duplicative of previously incurred costs and/or one-time costs. |
| MEDTRONIC PLC GAAP TO NON-GAAP RECONCILIATIONS(1) (Unaudited) | |||||||||||||||
| Three months ended January 23, 2026 | |||||||||||||||
| (in millions) | Net Sales | SG&A | SG&A | R&D | R&D | Other | Other | Other Non- | |||||||
| GAAP | $ 9,017 | $ 2,956 | 32.8 % | $ 722 | 8.0 % | $ 35 | 0.4 % | $ (121) | |||||||
| Non-GAAP Adjustments: | |||||||||||||||
| Restructuring and associated costs(2) | — | (6) | (0.1) | — | — | — | — | — | |||||||
| Acquisition and divestiture-related items(3) | — | (35) | (0.4) | — | — | 3 | — | — | |||||||
| (Gain)/loss on minority investments(4) | — | — | — | — | — | — | — | (8) | |||||||
| Non-GAAP | $ 9,017 | $ 2,914 | 32.3 % | $ 722 | 8.0 % | $ 38 | 0.4 % | $ (130) | |||||||
| Nine months ended January 23, 2026 | |||||||||||||||
| (in millions) | Net Sales | SG&A | SG&A | R&D | R&D | Other | Other | Other Non- | |||||||
| GAAP | $ 26,557 | $ 8,727 | 32.9 % | $ 2,202 | 8.3 % | $ 126 | 0.5 % | $ (247) | |||||||
| Non-GAAP Adjustments: | |||||||||||||||
| Restructuring and associated costs(2) | — | (15) | — | — | — | — | — | — | |||||||
| Acquisition and divestiture-related items(3) | — | (96) | (0.3) | — | — | 21 | 0.1 | — | |||||||
| Other(5) | (39) | — | — | — | — | — | — | — | |||||||
| (Gain)/loss on minority investments(4) | — | — | — | — | — | — | — | (145) | |||||||
| Non-GAAP | $ 26,518 | $ 8,616 | 32.5 % | $ 2,202 | 8.3 % | $ 147 | 0.6 % | $ (392) | |||||||
| See description of non-GAAP financial measures contained in the press release dated February 17, 2026. | |
| (1) | The data in this schedule has been intentionally rounded to the nearest million, and, therefore, may not sum. |
| (2) | The charges primarily relate to employee termination benefits, facility related and contract termination costs, and asset write offs. |
| (3) | The charges primarily include business combination costs, changes in fair value of contingent consideration, exit of business-related charges, and gains related to certain business or asset sales. Exit of business-related charges primarily relate to the impending separation of the Diabetes business and costs associated with the Company's June 2021 decision to stop the distribution and sale of the Medtronic HVAD System. |
| (4) | We exclude unrealized and realized gains and losses on our minority investments as we do not believe that these components of income or expense have a direct correlation to our ongoing or future business operations. |
| (5) | Reflects adjustments to the Company's Italian payback accruals resulting from the Legislative Decree published by the Italian government on June 30, 2025 for certain prior years since 2015. |
| MEDTRONIC PLC GAAP TO NON-GAAP RECONCILIATIONS(1) (Unaudited) | |||
| Nine months ended | |||
| (in millions) | January 23, 2026 | January 24, 2025 | |
| Net cash provided by operating activities | $ 4,757 | $ 4,516 | |
| Additions to property, plant, and equipment | (1,416) | (1,400) | |
| Free Cash Flow(2) | $ 3,341 | $ 3,116 | |
| See description of non-GAAP financial measures contained in the press release dated February 17, 2026. | |
| (1) | The data in this schedule has been intentionally rounded to the nearest million, and, therefore, may not sum. |
| (2) | Free cash flow represents operating cash flows less property, plant, and equipment additions. |
| MEDTRONIC PLC CONSOLIDATED STATEMENTS OF CASH FLOWS (Unaudited) | |||
| Nine months ended | |||
| (in millions) | January 23, 2026 | January 24, 2025 | |
| Operating Activities: | |||
| Net income | $ 3,578 | $ 3,630 | |
| Adjustments to reconcile net income to net cash provided by operating activities: | |||
| Depreciation and amortization | 2,242 | 2,021 | |
| Provision for credit losses | 102 | 96 | |
| Deferred income taxes | 59 | (81) | |
| Stock-based compensation | 362 | 340 | |
| Other, net | 280 | 14 | |
| Change in operating assets and liabilities, net of acquisitions and divestitures: | |||
| Accounts receivable, net | 87 | (184) | |
| Inventories | (803) | (478) | |
| Accounts payable and accrued liabilities | (77) | (157) | |
| Other operating assets and liabilities | (1,074) | (685) | |
| Net cash provided by operating activities | 4,757 | 4,516 | |
| Investing Activities: | |||
| Acquisitions, net of cash acquired | — | (98) | |
| Additions to property, plant, and equipment | (1,416) | (1,400) | |
| Purchases of investments | (6,572) | (6,093) | |
| Sales and maturities of investments | 5,982 | 6,255 | |
| Other investing activities, net | (10) | (111) | |
| Net cash used in investing activities | (2,017) | (1,447) | |
| Financing Activities: | |||
| Change in current debt obligations, net | 173 | (1,070) | |
| Issuance of long-term debt | 1,747 | 3,209 | |
| Payments on long-term debt | (2,930) | — | |
| Dividends to shareholders | (2,731) | (2,692) | |
| Issuance of ordinary shares | 419 | 400 | |
| Repurchase of ordinary shares | (600) | (2,961) | |
| Other financing activities, net | 60 | 96 | |
| Net cash used in financing activities | (3,863) | (3,018) | |
| Effect of exchange rate changes on cash and cash equivalents | 52 | (95) | |
| Net change in cash and cash equivalents | (1,072) | (44) | |
| Cash and cash equivalents at beginning of period | 2,218 | 1,284 | |
| Cash and cash equivalents at end of period | $ 1,147 | $ 1,240 | |
| Supplemental Cash Flow Information | |||
| Cash paid for: | |||
| Income taxes | $ 1,598 | $ 1,515 | |
| Interest | 573 | 567 | |
| The data in this schedule has been intentionally rounded to the nearest million, and, therefore, may not sum. |
PDF - https://mma.prnewswire.com/media/2904972/Earnings_Presentation_FY26Q3_Final.pdf
PDF - https://mma.prnewswire.com/media/2904973/Exhibit_99_1___FY26_Q3_Earnings_Release_2_16.pdf
Cardiovascular portfolio up 11% year-over-year; Cardiac Ablation Solutions grew 80% on strength of pulsed field ablation portfolio
GALWAY, Ireland, Feb. 17, 2026 /PRNewswire/ -- Medtronic plc (NYSE: MDT), a global leader in healthcare technology, today announced financial results for its third quarter (Q3) of fiscal year 2026 (FY26), which ended January 23, 2026.
Q3 Key Highlights
- Revenue of $9.0 billion, increased 8.7% as reported and 6.0% organic, 50 basis points ahead of Q3 guidance
- GAAP diluted EPS of $0.89; non-GAAP diluted EPS of $1.36, three cents ahead of Q3 guidance mid-point
- Company reiterates FY26 organic revenue growth and EPS guidance
- Cardiac Ablation Solutions revenue increased 80%, including 137% in the U.S., on strength of pulsed field ablation (PFA) portfolio
- Secured CE Mark for Sphere-360™ and initiated U.S. pivotal trial
- Secured U.S. FDA clearance for Hugo™ robotic-assisted surgery; first cases completed this month
- Secured U.S. FDA clearance for Stealth AXiS™ Surgical System for spinal procedures
- Diabetes revenue increased 8.3% led by double-digit strength in International markets
- Executing M&A strategy with two key transactions in the quarter: CathWorks in Coronary and Renal Denervation and Anteris in Structural Heart
"Q3 marks another strong quarter, delivering 6% organic revenue growth, ahead of guidance, demonstrating the strength of our portfolio," said Geoff Martha, Medtronic chairman and chief executive officer. "By unlocking new markets and investing in high-growth opportunities, we are accelerating performance across the company. Our innovation pipeline and portfolio breadth give us confidence in our ability to sustain long-term growth. It's an exciting time for Medtronic."
Financial Results
Medtronic reported Q3 worldwide revenue of $9.017 billion, an increase of 8.7% as reported and 6.0% on an organic basis. The organic revenue growth comparison excludes:
- Other revenue of $32 million in the current year and $32 million in the prior year
- Revenue from the Dutch Obesity Clinic (NOK) divestiture with no revenue in the current year and $15 million in the prior year
- Foreign exchange benefit of $242 million on the remaining segments
Q3 revenue by segment included:
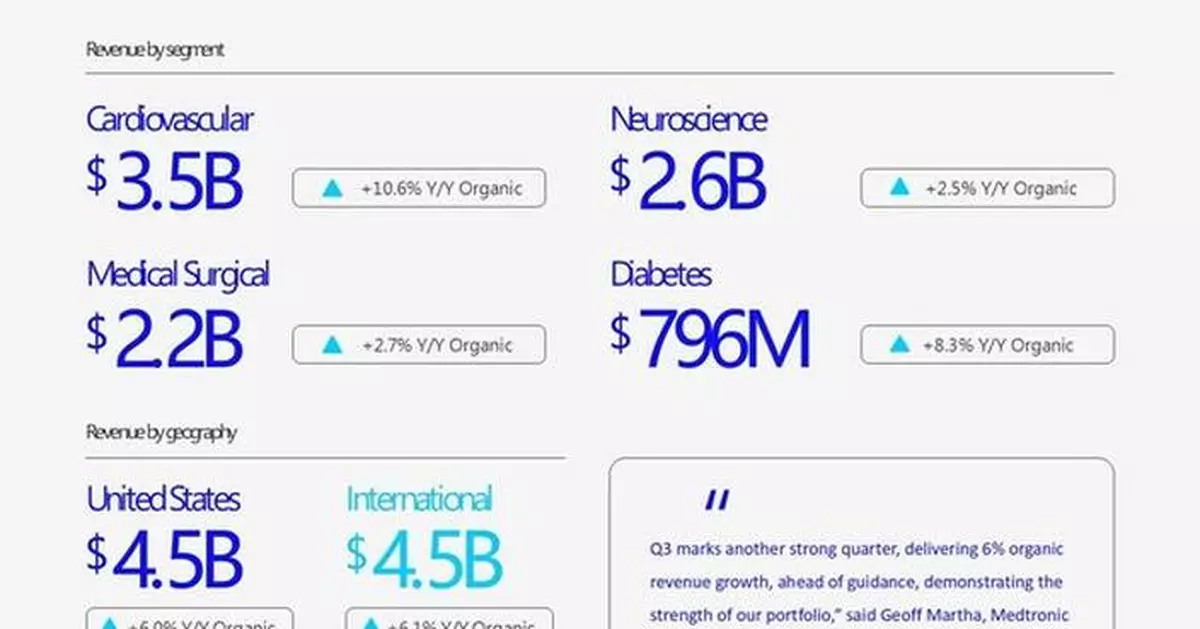
- Cardiovascular Portfolio revenue of $3.457 billion, an increase of 13.8% as reported and 10.6% organic, with high-teens increase in Cardiac Rhythm & Heart Failure, low-single digit increase in Structural Heart & Aortic, and mid-single digit increase in Coronary & Peripheral Vascular, all on an organic basis
- Neuroscience Portfolio revenue of $2.558 billion, an increase of 4.1% reported and 2.5% organic, with mid-single digit increase in Neuromodulation, mid-single digit increase in Cranial & Spinal Technologies, and flat result in Specialty Therapies, all on an organic basis
- Medical Surgical Portfolio revenue of $2.173 billion, an increase of 4.9% as reported and 2.7% organic, with low-single digit increase in Surgical & Endoscopy, and high-single digit increase in Acute Care & Monitoring, all on an organic basis
- Diabetes business revenue of $796 million, an increase of 14.8% as reported and 8.3% organic
Q3 GAAP operating profit and operating margin were $1.464 billion and 16.2%, respectively. As detailed in the financial schedules included at the end of the release, Q3 non-GAAP operating profit and operating margin were $2.177 billion and 24.1%, respectively.
Q3 GAAP net income and diluted earnings per share (EPS) were $1.143 billion and $0.89, respectively. As detailed in the financial schedules included at the end of this release, Q3 non-GAAP net income and non-GAAP diluted EPS were $1.750 billion and $1.36, respectively.
Guidance
The company reiterates its FY26 organic revenue growth of approximately 5.5% and diluted non-GAAP EPS guidance of $5.62 to $5.66. This includes a potential impact from tariffs of approximately $185 million, unchanged from the prior guidance. Excluding the potential impact from tariffs, this guidance represents FY26 diluted non-GAAP EPS growth of approximately 4.5%.
"This quarter, we again delivered accelerated growth while investing decisively in our future," said Thierry Piéton, Medtronic chief financial officer. "We continued to invest in R&D to strengthen our innovation pipeline, funded significant growth opportunities while driving G&A leverage, and we executed on our M&A and venture strategy with two key transactions in the quarter. Bottom line, we are executing on our roadmap and positioning the business for sustainable growth."
Video Webcast Information
Medtronic will host a video webcast today, February 17, at 8:00 a.m. EST (7:00 a.m. CST) to provide information about its business for the public, investors, analysts, and news media. This webcast can be accessed by clicking on the Quarterly Earnings icon at investorrelations.medtronic.com, and this earnings release will be archived at news.medtronic.com. Within 24 hours of the webcast, a replay of the webcast and transcript of the company's prepared remarks will be available by clicking on the Past Events and Presentations link under the News & Events drop-down at investorrelations.medtronic.com.
Financial Schedules and Earnings Presentation
The third quarter financial schedules and non-GAAP reconciliations can be viewed by clicking on the Quarterly Earnings link at investorrelations.medtronic.com. To view a printable PDF of the financial schedules and non-GAAP reconciliations, click here. To view the earnings presentation, click here.
About Medtronic
Bold thinking. Bolder actions. We are Medtronic. Medtronic plc, headquartered in Galway, Ireland, is the leading global healthcare technology company that boldly attacks the most challenging health problems facing humanity by searching out and finding solutions. Our Mission — to alleviate pain, restore health, and extend life — unites a global team of 95,000+ passionate people across more than 150 countries. Our technologies and therapies treat 70 health conditions and include cardiac devices, surgical robotics, insulin pumps, surgical tools, patient monitoring systems, and more. Powered by our diverse knowledge, insatiable curiosity, and desire to help all those who need it, we deliver innovative technologies that transform the lives of two people every second, every hour, every day. Expect more from us as we empower insight-driven care, experiences that put people first, and better outcomes for our world. In everything we do, we are engineering the extraordinary. For more information on Medtronic (NYSE: MDT), visit www.Medtronic.com and follow on LinkedIn.
FORWARD LOOKING STATEMENTS
This press release contains forward-looking statements within the meaning of the Private Securities Litigation Reform Act of 1995, which are subject to risks and uncertainties, including risks related to competitive factors, difficulties and delays inherent in the development, manufacturing, marketing and sale of medical products, government regulation, geopolitical conflicts, changing global trade policies, material acquisition and divestiture transactions, general economic conditions, and other risks and uncertainties described in the company's periodic reports on file with the U.S. Securities and Exchange Commission including the most recent Annual Report on Form 10-K of the company. In some cases, you can identify these statements by forward-looking words or expressions, such as "anticipate," "believe," "could," "estimate," "expect," "forecast," "intend," "looking ahead," "may," "plan," "possible," "potential," "project," "should," "going to," "will," and similar words or expressions, the negative or plural of such words or expressions and other comparable terminology. Actual results may differ materially from anticipated results. Medtronic does not undertake to update its forward-looking statements or any of the information contained in this press release, including to reflect future events or circumstances.
NON-GAAP FINANCIAL MEASURES
This press release contains financial measures, including adjusted net income, adjusted diluted EPS, and organic revenue, which are considered "non-GAAP" financial measures under applicable SEC rules and regulations. References to quarterly or annual figures increasing, decreasing or remaining flat are in comparison to fiscal year 2025, and references to sequential changes are in comparison to the prior fiscal quarter. Unless stated otherwise, quarterly and annual rates and ranges are given on an organic basis.
Medtronic management believes that non-GAAP financial measures provide information useful to investors in understanding the company's underlying operational performance and trends and to facilitate comparisons with the performance of other companies in the med tech industry. Non-GAAP net income and diluted EPS exclude the effect of certain charges or gains that contribute to or reduce earnings but that result from transactions or events that management believes may or may not recur with similar materiality or impact to operations in future periods (Non-GAAP Adjustments). Medtronic generally uses non-GAAP financial measures to facilitate management's review of the operational performance of the company and as a basis for strategic planning. Non-GAAP financial measures should be considered supplemental to and not a substitute for financial information prepared in accordance with U.S. generally accepted accounting principles (GAAP), and investors are cautioned that Medtronic may calculate non-GAAP financial measures in a way that is different from other companies. Management strongly encourages investors to review the company's consolidated financial statements and publicly filed reports in their entirety. Reconciliations of the non-GAAP financial measures to the most directly comparable GAAP financial measures are included in the financial schedules accompanying this press release.
Medtronic calculates forward-looking non-GAAP financial measures based on internal forecasts that omit certain amounts that would be included in GAAP financial measures. For instance, forward-looking organic revenue growth guidance excludes the impact of foreign currency fluctuations, as well as significant acquisitions, divestitures, or other significant discrete items. Forward-looking diluted non-GAAP EPS guidance also excludes other potential charges or gains that would be recorded as Non-GAAP Adjustments to earnings during the fiscal year. Medtronic does not attempt to provide reconciliations of forward-looking non-GAAP EPS guidance to projected GAAP EPS guidance because the combined impact and timing of recognition of these potential charges or gains is inherently uncertain and difficult to predict and is unavailable without unreasonable efforts. In addition, the company believes such reconciliations would imply a degree of precision and certainty that could be confusing to investors. Such items could have a substantial impact on GAAP measures of financial performance.
Contacts:
Justin Paquette
Public Relations
+1-612-271-7935
Ingrid Goldberg
Investor Relations
+1-763-505-2696
MEDTRONIC PLC
WORLD WIDE REVENUE(1)
(Unaudited)
THIRD QUARTER
YEAR-TO-DATE
REPORTED
ORGANIC
REPORTED
ORGANIC
(in millions)
FY26
FY25
Growth
Currency
Impact(4)
FY26(5)
FY25(5)
Growth
FY26
FY25
Growth
Currency
Impact(4)
FY26(6)
FY25(6)
Growth
Cardiovascular
$ 3,457
$ 3,037
13.8 %
$ 99
$ 3,359
$ 3,037
10.6 %
$ 10,179
$ 9,145
11.3 %
$ 213
$ 9,966
$ 9,145
9.0 %
Cardiac Rhythm & Heart Failure
1,856
1,545
20.1
48
1,808
1,545
17.0
5,394
4,659
15.8
107
5,287
4,659
13.5
Structural Heart & Aortic
929
874
6.3
32
897
874
2.6
2,814
2,610
7.8
71
2,743
2,610
5.1
Coronary & Peripheral Vascular
672
618
8.8
18
654
618
5.9
1,971
1,876
5.0
35
1,935
1,876
3.1
Neuroscience
2,558
2,458
4.1
38
2,520
2,458
2.5
7,536
7,226
4.3
81
7,455
7,226
3.2
Cranial & Spinal Technologies
1,310
1,250
4.8
13
1,296
1,250
3.7
3,819
3,632
5.1
31
3,788
3,632
4.3
Specialty Therapies
746
732
1.9
15
731
732
(0.2)
2,191
2,181
0.4
28
2,163
2,181
(0.8)
Neuromodulation
503
476
5.8
10
493
476
3.6
1,527
1,413
8.1
22
1,504
1,413
6.5
Medical Surgical
2,173
2,072
4.9
61
2,112
2,057
2.7
6,428
6,196
3.7
128
6,295
6,164
2.1
Surgical & Endoscopy
1,654
1,596
3.6
51
1,603
1,581
1.4
4,945
4,790
3.2
106
4,834
4,758
1.6
Acute Care & Monitoring
519
476
9.1
10
509
476
7.0
1,483
1,406
5.5
22
1,461
1,406
3.9
Diabetes
796
694
14.8
44
751
694
8.3
2,274
2,027
12.2
90
2,184
2,027
7.8
Total Reportable Segments
8,985
8,260
8.8
242
8,743
8,245
6.0
26,417
24,593
7.4
512
25,901
24,562
5.4
Other(2)
32
32
3.0
—
—
—
—
140
17
NM(3)
4
—
—
—
TOTAL
$ 9,017
$ 8,292
8.7 %
$ 243
$ 8,743
$ 8,245
6.0 %
$ 26,557
$ 24,610
7.9 %
$ 516
$ 25,901
$ 24,562
5.4 %
| See description of non-GAAP financial measures contained in the press release dated February 17, 2026. | |
| (1) | The data in this schedule has been intentionally rounded to the nearest million and, therefore, may not sum. Percentages have been calculated using actual, non-rounded figures and, therefore, may not recalculate precisely. |
| (2) | Includes the historical operations and ongoing transition agreements from businesses the Company has exited or divested, and for the year-to-date figures, adjustments to the Company's Italian payback accruals resulting from the two July 22, 2024 rulings by the Constitutional Court and the Legislative Decree published by the Italian government on June 30, 2025 for certain prior years since 2015. |
| (3) | Not meaningful (NM). |
| (4) | The currency impact to revenue measures the change in revenue between current and prior year periods using constant exchange rates. |
| (5) | The three months ended January 23, 2026 excludes $275 million of revenue adjustments, including $32 million of inorganic revenue for the transition activity noted in (2) and $242 million of favorable currency impact on the remaining segments. The three months ended January 24, 2025 excludes $47 million of revenue adjustments, including $32 million of inorganic revenue related to the transition activity noted in (2) and $15 million of inorganic revenue related to a sale of business in the Surgical and Endoscopy division. |
| (6) | The nine months ended January 23, 2026 excludes $656 million of revenue adjustments, including $39 million reduction in the Italian payback accruals due to changes in estimates further described in note (2), $101 million of inorganic revenue for the transition activity noted in (2), $5 million of inorganic revenue related to a sale of business in the Surgical and Endoscopy division, and $512 million of favorable currency impact on the remaining segments. The nine months ended January 24, 2025 excludes $48 million of revenue adjustments, including $90 million of incremental Italian payback accruals further described in note (2), $106 million of inorganic revenue related to the transition activity noted in (2), and $31 million of inorganic revenue related to a sale of business in the Surgical and Endoscopy division. |
See description of non-GAAP financial measures contained in the press release dated February 17, 2026.
(1)
The data in this schedule has been intentionally rounded to the nearest million and, therefore, may not sum. Percentages have been calculated using actual, non-rounded figures and, therefore, may not recalculate precisely.
(2)
Includes the historical operations and ongoing transition agreements from businesses the Company has exited or divested, and for the year-to-date figures, adjustments to the Company's Italian payback accruals resulting from the two July 22, 2024 rulings by the Constitutional Court and the Legislative Decree published by the Italian government on June 30, 2025 for certain prior years since 2015.
(3)
Not meaningful (NM).
(4)
The currency impact to revenue measures the change in revenue between current and prior year periods using constant exchange rates.
(5)
The three months ended January 23, 2026 excludes $275 million of revenue adjustments, including $32 million of inorganic revenue for the transition activity noted in (2) and $242 million of favorable currency impact on the remaining segments. The three months ended January 24, 2025 excludes $47 million of revenue adjustments, including $32 million of inorganic revenue related to the transition activity noted in (2) and $15 million of inorganic revenue related to a sale of business in the Surgical and Endoscopy division.
(6)
The nine months ended January 23, 2026 excludes $656 million of revenue adjustments, including $39 million reduction in the Italian payback accruals due to changes in estimates further described in note (2), $101 million of inorganic revenue for the transition activity noted in (2), $5 million of inorganic revenue related to a sale of business in the Surgical and Endoscopy division, and $512 million of favorable currency impact on the remaining segments. The nine months ended January 24, 2025 excludes $48 million of revenue adjustments, including $90 million of incremental Italian payback accruals further described in note (2), $106 million of inorganic revenue related to the transition activity noted in (2), and $31 million of inorganic revenue related to a sale of business in the Surgical and Endoscopy division.
| MEDTRONIC PLC U.S. REVENUE(1)(2) (Unaudited) | ||||||||||||||||||||||||
| THIRD QUARTER | YEAR-TO-DATE | |||||||||||||||||||||||
| REPORTED | ORGANIC | REPORTED | ORGANIC | |||||||||||||||||||||
| (in millions) | FY26 | FY25 | Growth | FY26 | FY25 | Growth | FY26 | FY25 | Growth | FY26 | FY25 | Growth | ||||||||||||
| Cardiovascular | $ 1,589 | $ 1,405 | 13.1 % | $ 1,589 | $ 1,405 | 13.1 % | $ 4,660 | $ 4,242 | 9.9 % | $ 4,660 | $ 4,242 | 9.9 % | ||||||||||||
| Cardiac Rhythm & Heart Failure | 953 | 775 | 23.0 | 953 | 775 | 23.0 | 2,708 | 2,309 | 17.3 | 2,708 | 2,309 | 17.3 | ||||||||||||
| Structural Heart & Aortic | 367 | 372 | (1.4) | 367 | 372 | (1.4) | 1,128 | 1,129 | — | 1,128 | 1,129 | — | ||||||||||||
| Coronary & Peripheral Vascular | 269 | 258 | 4.2 | 269 | 258 | 4.2 | 824 | 804 | 2.5 | 824 | 804 | 2.5 | ||||||||||||
| Neuroscience | 1,709 | 1,689 | 1.2 | 1,709 | 1,689 | 1.2 | 5,063 | 4,931 | 2.7 | 5,063 | 4,931 | 2.7 | ||||||||||||
| Cranial & Spinal Technologies | 977 | 943 | 3.6 | 977 | 943 | 3.6 | 2,833 | 2,724 | 4.0 | 2,833 | 2,724 | 4.0 | ||||||||||||
| Specialty Therapies | 402 | 419 | (4.0) | 402 | 419 | (4.0) | 1,204 | 1,235 | (2.5) | 1,204 | 1,235 | (2.5) | ||||||||||||
| Neuromodulation | 330 | 327 | 1.1 | 330 | 327 | 1.1 | 1,026 | 972 | 5.6 | 1,026 | 972 | 5.6 | ||||||||||||
| Medical Surgical | 929 | 893 | 4.1 | 929 | 893 | 4.1 | 2,756 | 2,718 | 1.4 | 2,756 | 2,718 | 1.4 | ||||||||||||
| Surgical & Endoscopy | 634 | 623 | 1.7 | 634 | 623 | 1.7 | 1,920 | 1,928 | (0.4) | 1,920 | 1,928 | (0.4) | ||||||||||||
| Acute Care & Monitoring | 295 | 269 | 9.5 | 295 | 269 | 9.5 | 836 | 790 | 5.8 | 836 | 790 | 5.8 | ||||||||||||
| Diabetes | 248 | 236 | 4.9 | 248 | 236 | 4.9 | 695 | 683 | 1.7 | 695 | 683 | 1.7 | ||||||||||||
| Total Reportable Segments | 4,475 | 4,223 | 6.0 | 4,475 | 4,223 | 6.0 | 13,174 | 12,573 | 4.8 | 13,174 | 12,573 | 4.8 | ||||||||||||
| Other(3) | 18 | 15 | 23.4 | — | — | — | 60 | 51 | 16.8 | — | — | — | ||||||||||||
| TOTAL | $ 4,493 | $ 4,237 | 6.0 % | $ 4,475 | $ 4,223 | 6.0 % | $ 13,234 | $ 12,624 | 4.8 % | $ 13,174 | $ 12,573 | 4.8 % | ||||||||||||
MEDTRONIC PLC
U.S. REVENUE(1)(2)
(Unaudited)
THIRD QUARTER
YEAR-TO-DATE
REPORTED
ORGANIC
REPORTED
ORGANIC
(in millions)
FY26
FY25
Growth
FY26
FY25
Growth
FY26
FY25
Growth
FY26
FY25
Growth
Cardiovascular
$ 1,589
$ 1,405
13.1 %
$ 1,589
$ 1,405
13.1 %
$ 4,660
$ 4,242
9.9 %
$ 4,660
$ 4,242
9.9 %
Cardiac Rhythm & Heart Failure
953
775
23.0
953
775
23.0
2,708
2,309
17.3
2,708
2,309
17.3
Structural Heart & Aortic
367
372
(1.4)
367
372
(1.4)
1,128
1,129
—
1,128
1,129
—
Coronary & Peripheral Vascular
269
258
4.2
269
258
4.2
824
804
2.5
824
804
2.5
Neuroscience
1,709
1,689
1.2
1,709
1,689
1.2
5,063
4,931
2.7
5,063
4,931
2.7
Cranial & Spinal Technologies
977
943
3.6
977
943
3.6
2,833
2,724
4.0
2,833
2,724
4.0
Specialty Therapies
402
419
(4.0)
402
419
(4.0)
1,204
1,235
(2.5)
1,204
1,235
(2.5)
Neuromodulation
330
327
1.1
330
327
1.1
1,026
972
5.6
1,026
972
5.6
Medical Surgical
929
893
4.1
929
893
4.1
2,756
2,718
1.4
2,756
2,718
1.4
Surgical & Endoscopy
634
623
1.7
634
623
1.7
1,920
1,928
(0.4)
1,920
1,928
(0.4)
Acute Care & Monitoring
295
269
9.5
295
269
9.5
836
790
5.8
836
790
5.8
Diabetes
248
236
4.9
248
236
4.9
695
683
1.7
695
683
1.7
Total Reportable Segments
4,475
4,223
6.0
4,475
4,223
6.0
13,174
12,573
4.8
13,174
12,573
4.8
Other(3)
18
15
23.4
—
—
—
60
51
16.8
—
—
—
TOTAL
$ 4,493
$ 4,237
6.0 %
$ 4,475
$ 4,223
6.0 %
$ 13,234
$ 12,624
4.8 %
$ 13,174
$ 12,573
4.8 %
| See description of non-GAAP financial measures contained in the press release dated February 17, 2026. | |
| (1) | U.S. includes the United States and U.S. territories. |
| (2) | The data in this schedule has been intentionally rounded to the nearest million and, therefore, may not sum. Percentages have been calculated using actual, non-rounded figures and, therefore, may not recalculate precisely. |
| (3) | Includes historical operations and ongoing transition agreements from businesses the Company has exited or divested. |
See description of non-GAAP financial measures contained in the press release dated February 17, 2026.
(1)
U.S. includes the United States and U.S. territories.
(2)
The data in this schedule has been intentionally rounded to the nearest million and, therefore, may not sum. Percentages have been calculated using actual, non-rounded figures and, therefore, may not recalculate precisely.
(3)
Includes historical operations and ongoing transition agreements from businesses the Company has exited or divested.
| MEDTRONIC PLC INTERNATIONAL REVENUE(1) (Unaudited) | ||||||||||||||||||||||||||||
| THIRD QUARTER | YEAR-TO-DATE | |||||||||||||||||||||||||||
| REPORTED | ORGANIC | REPORTED | ORGANIC | |||||||||||||||||||||||||
| (in millions) | FY26 | FY25 | Growth | Currency | FY26(5) | FY25(5) | Growth | FY26 | FY25 | Growth | Currency | FY26(6) | FY25(6) | Growth | ||||||||||||||
| Cardiovascular | $ 1,868 | $ 1,632 | 14.5 % | $ 99 | $ 1,770 | $ 1,632 | 8.5 % | $ 5,519 | $ 4,904 | 12.5 % | $ 213 | $ 5,306 | $ 4,904 | 8.2 % | ||||||||||||||
| Cardiac Rhythm & Heart Failure | 903 | 770 | 17.3 | 48 | 855 | 770 | 11.0 | 2,686 | 2,350 | 14.3 | 107 | 2,580 | 2,350 | 9.8 | ||||||||||||||
| Structural Heart & Aortic | 562 | 502 | 12.0 | 32 | 530 | 502 | 5.5 | 1,686 | 1,482 | 13.8 | 71 | 1,615 | 1,482 | 9.0 | ||||||||||||||
| Coronary & Peripheral Vascular | 403 | 360 | 12.2 | 18 | 385 | 360 | 7.1 | 1,146 | 1,072 | 6.9 | 35 | 1,111 | 1,072 | 3.6 | ||||||||||||||
| Neuroscience | 849 | 769 | 10.4 | 38 | 811 | 769 | 5.4 | 2,474 | 2,295 | 7.8 | 81 | 2,392 | 2,295 | 4.2 | ||||||||||||||
| Cranial & Spinal Technologies | 333 | 307 | 8.4 | 13 | 320 | 307 | 4.1 | 985 | 907 | 8.6 | 31 | 955 | 907 | 5.2 | ||||||||||||||
| Specialty Therapies | 343 | 313 | 9.7 | 15 | 328 | 313 | 5.0 | 987 | 947 | 4.3 | 28 | 959 | 947 | 1.3 | ||||||||||||||
| Neuromodulation | 173 | 149 | 16.0 | 10 | 163 | 149 | 9.1 | 501 | 441 | 13.5 | 22 | 478 | 441 | 8.4 | ||||||||||||||
| Medical Surgical | 1,244 | 1,180 | 5.5 | 61 | 1,183 | 1,165 | 1.6 | 3,671 | 3,478 | 5.6 | 128 | 3,539 | 3,447 | 2.7 | ||||||||||||||
| Surgical & Endoscopy | 1,020 | 973 | 4.8 | 51 | 969 | 958 | 1.1 | 3,024 | 2,862 | 5.7 | 106 | 2,914 | 2,831 | 2.9 | ||||||||||||||
| Acute Care & Monitoring | 224 | 206 | 8.5 | 10 | 214 | 206 | 3.8 | 647 | 616 | 5.0 | 22 | 625 | 616 | 1.4 | ||||||||||||||
| Diabetes | 548 | 457 | 19.8 | 44 | 504 | 457 | 10.1 | 1,579 | 1,344 | 17.5 | 90 | 1,489 | 1,344 | 10.9 | ||||||||||||||
| Total Reportable Segments | 4,510 | 4,038 | 11.7 | 242 | 4,267 | 4,023 | 6.1 | 13,243 | 12,020 | 10.2 | 512 | 12,726 | 11,989 | 6.2 | ||||||||||||||
| Other(2) | 14 | 17 | (14.6) | — | — | — | — | 80 | (35) | NM(3) | 4 | — | — | — | ||||||||||||||
| TOTAL | $ 4,524 | $ 4,055 | 11.6 % | $ 243 | $ 4,267 | $ 4,023 | 6.1 % | $ 13,323 | $ 11,986 | 11.2 % | $ 516 | $ 12,726 | $ 11,989 | 6.2 % | ||||||||||||||
MEDTRONIC PLC
INTERNATIONAL REVENUE(1)
(Unaudited)
THIRD QUARTER
YEAR-TO-DATE
REPORTED
ORGANIC
REPORTED
ORGANIC
(in millions)
FY26
FY25
Growth
Currency
Impact(4)
FY26(5)
FY25(5)
Growth
FY26
FY25
Growth
Currency
Impact(4)
FY26(6)
FY25(6)
Growth
Cardiovascular
$ 1,868
$ 1,632
14.5 %
$ 99
$ 1,770
$ 1,632
8.5 %
$ 5,519
$ 4,904
12.5 %
$ 213
$ 5,306
$ 4,904
8.2 %
Cardiac Rhythm & Heart Failure
903
770
17.3
48
855
770
11.0
2,686
2,350
14.3
107
2,580
2,350
9.8
Structural Heart & Aortic
562
502
12.0
32
530
502
5.5
1,686
1,482
13.8
71
1,615
1,482
9.0
Coronary & Peripheral Vascular
403
360
12.2
18
385
360
7.1
1,146
1,072
6.9
35
1,111
1,072
3.6
Neuroscience
849
769
10.4
38
811
769
5.4
2,474
2,295
7.8
81
2,392
2,295
4.2
Cranial & Spinal Technologies
333
307
8.4
13
320
307
4.1
985
907
8.6
31
955
907
5.2
Specialty Therapies
343
313
9.7
15
328
313
5.0
987
947
4.3
28
959
947
1.3
Neuromodulation
173
149
16.0
10
163
149
9.1
501
441
13.5
22
478
441
8.4
Medical Surgical
1,244
1,180
5.5
61
1,183
1,165
1.6
3,671
3,478
5.6
128
3,539
3,447
2.7
Surgical & Endoscopy
1,020
973
4.8
51
969
958
1.1
3,024
2,862
5.7
106
2,914
2,831
2.9
Acute Care & Monitoring
224
206
8.5
10
214
206
3.8
647
616
5.0
22
625
616
1.4
Diabetes
548
457
19.8
44
504
457
10.1
1,579
1,344
17.5
90
1,489
1,344
10.9
Total Reportable Segments
4,510
4,038
11.7
242
4,267
4,023
6.1
13,243
12,020
10.2
512
12,726
11,989
6.2
Other(2)
14
17
(14.6)
—
—
—
—
80
(35)
NM(3)
4
—
—
—
TOTAL
$ 4,524
$ 4,055
11.6 %
$ 243
$ 4,267
$ 4,023
6.1 %
$ 13,323
$ 11,986
11.2 %
$ 516
$ 12,726
$ 11,989
6.2 %
| See description of non-GAAP financial measures contained in the press release dated February 17, 2026. | |
| (1) | The data in this schedule has been intentionally rounded to the nearest million and, therefore, may not sum. Percentages have been calculated using actual, non-rounded figures and, therefore, may not recalculate precisely. |
| (2) | Includes the historical operations and ongoing transition agreements from businesses the Company has exited or divested, and for the year-to-date figures, adjustments to the Company's Italian payback accruals resulting from the two July 22, 2024 rulings by the Constitutional Court and the Legislative Decree published by the Italian government on June 30, 2025 for certain prior years since 2015. |
| (3) | Not meaningful (NM). |
| (4) | The currency impact to revenue measures the change in revenue between current and prior year periods using constant exchange rates. |
| (5) | The three months ended January 23, 2026 excludes $257 million of revenue adjustments, including $14 million of inorganic revenue for the transition activity noted in (2) and $242 million of favorable currency impact on the remaining segments. The three months ended January 24, 2025 excludes $32 million of revenue adjustments, including $17 million of inorganic revenue related to the transition activity noted in (2) and $15 million of inorganic revenue related to a sale of business in the Surgical and Endoscopy division. |
| (6) | The nine months ended January 23, 2026 excludes $597 million of revenue adjustments, including $39 million reduction in the Italian payback accruals due to changes in estimates further described in note (2), $41 million of inorganic revenue for the transition activity noted in (2), $5 million of inorganic revenue related to a sale of business in the Surgical and Endoscopy division, and $512 million of favorable currency impact on the remaining segments. The nine months ended January 24, 2025 excludes $3 million of revenue adjustments, including $90 million of incremental Italian payback accruals further described in note (2), $55 million of inorganic revenue related to the transition activity noted in (2), and $31 million of inorganic revenue related to a sale of business in the Surgical and Endoscopy division. |
See description of non-GAAP financial measures contained in the press release dated February 17, 2026.
(1)
The data in this schedule has been intentionally rounded to the nearest million and, therefore, may not sum. Percentages have been calculated using actual, non-rounded figures and, therefore, may not recalculate precisely.
(2)
Includes the historical operations and ongoing transition agreements from businesses the Company has exited or divested, and for the year-to-date figures, adjustments to the Company's Italian payback accruals resulting from the two July 22, 2024 rulings by the Constitutional Court and the Legislative Decree published by the Italian government on June 30, 2025 for certain prior years since 2015.
(3)
Not meaningful (NM).
(4)
The currency impact to revenue measures the change in revenue between current and prior year periods using constant exchange rates.
(5)
The three months ended January 23, 2026 excludes $257 million of revenue adjustments, including $14 million of inorganic revenue for the transition activity noted in (2) and $242 million of favorable currency impact on the remaining segments. The three months ended January 24, 2025 excludes $32 million of revenue adjustments, including $17 million of inorganic revenue related to the transition activity noted in (2) and $15 million of inorganic revenue related to a sale of business in the Surgical and Endoscopy division.
(6)
The nine months ended January 23, 2026 excludes $597 million of revenue adjustments, including $39 million reduction in the Italian payback accruals due to changes in estimates further described in note (2), $41 million of inorganic revenue for the transition activity noted in (2), $5 million of inorganic revenue related to a sale of business in the Surgical and Endoscopy division, and $512 million of favorable currency impact on the remaining segments. The nine months ended January 24, 2025 excludes $3 million of revenue adjustments, including $90 million of incremental Italian payback accruals further described in note (2), $55 million of inorganic revenue related to the transition activity noted in (2), and $31 million of inorganic revenue related to a sale of business in the Surgical and Endoscopy division.
| MEDTRONIC PLC CONSOLIDATED STATEMENTS OF INCOME (Unaudited) | |||||||
| Three months ended | Nine months ended | ||||||
| (in millions, except per share data) | January 23, 2026 | January 24, 2025 | January 23, 2026 | January 24, 2025 | |||
| Net sales | $ 9,017 | $ 8,292 | $ 26,557 | $ 24,610 | |||
| Costs and expenses: | |||||||
| Cost of products sold, excluding amortization of intangible assets | 3,261 | 2,779 | 9,323 | 8,485 | |||
| Research and development expense | 722 | 675 | 2,202 | 2,048 | |||
| Selling, general, and administrative expense | 2,956 | 2,717 | 8,727 | 8,129 | |||
| Amortization of intangible assets | 441 | 416 | 1,364 | 1,243 | |||
| Restructuring charges, net | 77 | 43 | 131 | 120 | |||
| Certain litigation charges, net | 62 | 22 | 89 | 104 | |||
| Other operating expense (income), net | 35 | (5) | 126 | (38) | |||
| Operating profit | 1,464 | 1,646 | 4,594 | 4,519 | |||
| Other non-operating income, net | (121) | (72) | (247) | (403) | |||
| Interest expense, net | 181 | 179 | 539 | 555 | |||
| Income before income taxes | 1,404 | 1,540 | 4,302 | 4,367 | |||
| Income tax provision | 254 | 237 | 724 | 737 | |||
| Net income | 1,150 | 1,303 | 3,578 | 3,630 | |||
| Net income attributable to noncontrolling interests | (6) | (9) | (21) | (24) | |||
| Net income attributable to Medtronic | $ 1,143 | $ 1,294 | $ 3,557 | $ 3,606 | |||
| Basic earnings per share | $ 0.89 | $ 1.01 | $ 2.77 | $ 2.80 | |||
| Diluted earnings per share | $ 0.89 | $ 1.01 | $ 2.76 | $ 2.79 | |||
| Basic weighted average shares outstanding | 1,282.6 | 1,282.4 | 1,282.1 | 1,286.7 | |||
| Diluted weighted average shares outstanding | 1,289.5 | 1,286.2 | 1,288.2 | 1,290.6 | |||
MEDTRONIC PLC
CONSOLIDATED STATEMENTS OF INCOME
(Unaudited)
Three months ended
Nine months ended
(in millions, except per share data)
January 23, 2026
January 24, 2025
January 23, 2026
January 24, 2025
Net sales
$ 9,017
$ 8,292
$ 26,557
$ 24,610
Costs and expenses:
Cost of products sold, excluding amortization of intangible assets
3,261
2,779
9,323
8,485
Research and development expense
722
675
2,202
2,048
Selling, general, and administrative expense
2,956
2,717
8,727
8,129
Amortization of intangible assets
441
416
1,364
1,243
Restructuring charges, net
77
43
131
120
Certain litigation charges, net
62
22
89
104
Other operating expense (income), net
35
(5)
126
(38)
Operating profit
1,464
1,646
4,594
4,519
Other non-operating income, net
(121)
(72)
(247)
(403)
Interest expense, net
181
179
539
555
Income before income taxes
1,404
1,540
4,302
4,367
Income tax provision
254
237
724
737
Net income
1,150
1,303
3,578
3,630
Net income attributable to noncontrolling interests
(6)
(9)
(21)
(24)
Net income attributable to Medtronic
$ 1,143
$ 1,294
$ 3,557
$ 3,606
Basic earnings per share
$ 0.89
$ 1.01
$ 2.77
$ 2.80
Diluted earnings per share
$ 0.89
$ 1.01
$ 2.76
$ 2.79
Basic weighted average shares outstanding
1,282.6
1,282.4
1,282.1
1,286.7
Diluted weighted average shares outstanding
1,289.5
1,286.2
1,288.2
1,290.6
| The data in the schedule above has been intentionally rounded to the nearest million. |
The data in the schedule above has been intentionally rounded to the nearest million.
| MEDTRONIC PLC GAAP TO NON-GAAP RECONCILIATIONS(1) (Unaudited) | |||||||||||||||||
| Three months ended January 23, 2026 | |||||||||||||||||
| (in millions, except per share data) | Net | Cost of | Gross | Operating | Operating | Income | Net Income | Diluted | Effective | ||||||||
| GAAP | $ 9,017 | $ 3,261 | 63.8 % | $ 1,464 | 16.2 % | $ 1,404 | $ 1,143 | $ 0.89 | 18.1 % | ||||||||
| Non-GAAP Adjustments: | |||||||||||||||||
| Amortization of intangible assets(2) | — | — | — | 441 | 4.9 | 441 | 360 | 0.28 | 18.4 | ||||||||
| Restructuring and associated costs(3) | — | (89) | 1.0 | 172 | 1.9 | 172 | 141 | 0.11 | 18.0 | ||||||||
| Acquisition and divestiture-related items(4) | — | (6) | 0.1 | 38 | 0.4 | 38 | 33 | 0.03 | 13.2 | ||||||||
| Certain litigation charges, net | — | — | — | 62 | 0.7 | 62 | 52 | 0.04 | 16.1 | ||||||||
| (Gain)/loss on minority investments(5) | — | — | — | — | — | 8 | 7 | 0.01 | 12.5 | ||||||||
| Certain tax adjustments, net | — | — | — | — | — | — | 14 | 0.01 | — | ||||||||
| Non-GAAP | $ 9,017 | $ 3,166 | 64.9 % | $ 2,177 | 24.1 % | $ 2,125 | $ 1,750 | $ 1.36 | 17.3 % | ||||||||
| Currency impact | (243) | (52) | (0.4) | (67) | (0.1) | (0.04) | |||||||||||
| Currency Adjusted | $ 8,775 | $ 3,114 | 64.5 % | $ 2,110 | 24.0 % | $ 1.32 | |||||||||||
| Three months ended January 24, 2025 | |||||||||||||||||
| (in millions, except per share data) | Net | Cost of | Gross | Operating | Operating | Income | Net Income | Diluted | Effective | ||||||||
| GAAP | $ 8,292 | $ 2,779 | 66.5 % | $ 1,646 | 19.9 % | $ 1,540 | $ 1,294 | $ 1.01 | 15.4 % | ||||||||
| Non-GAAP Adjustments: | |||||||||||||||||
| Amortization of intangible assets | — | — | — | 416 | 5.0 | 416 | 339 | 0.26 | 18.5 | ||||||||
| Restructuring and associated costs(3) | — | (4) | — | 46 | 0.6 | 46 | 37 | 0.03 | 19.6 | ||||||||
| Acquisition and divestiture-related items(4) | — | (1) | — | 28 | 0.3 | 28 | 23 | 0.02 | 17.9 | ||||||||
| Certain litigation charges, net | — | — | — | 22 | 0.3 | 22 | 18 | 0.01 | 22.7 | ||||||||
| (Gain)/loss on minority investments(5) | — | — | — | — | — | 68 | 52 | 0.04 | 22.1 | ||||||||
| Medical device regulations(6) | — | (8) | 0.1 | 11 | 0.1 | 11 | 9 | 0.01 | 18.2 | ||||||||
| Certain tax adjustments, net | — | — | — | — | — | — | 15 | 0.01 | — | ||||||||
| Non-GAAP | $ 8,292 | $ 2,766 | 66.6 % | $ 2,169 | 26.2 % | $ 2,130 | $ 1,787 | $ 1.39 | 15.7 % | ||||||||
MEDTRONIC PLC
GAAP TO NON-GAAP RECONCILIATIONS(1)
(Unaudited)
Three months ended January 23, 2026
(in millions, except per share data)
Net
Sales
Cost of
Products
Sold
Gross
Margin
Percent
Operating
Profit
Operating
Profit
Percent
Income
Before
Income
Taxes
Net Income
attributable
to
Medtronic
Diluted
EPS
Effective
Tax Rate
GAAP
$ 9,017
$ 3,261
63.8 %
$ 1,464
16.2 %
$ 1,404
$ 1,143
$ 0.89
18.1 %
Non-GAAP Adjustments:
Amortization of intangible assets(2)
—
—
—
441
4.9
441
360
0.28
18.4
Restructuring and associated costs(3)
—
(89)
1.0
172
1.9
172
141
0.11
18.0
Acquisition and divestiture-related items(4)
—
(6)
0.1
38
0.4
38
33
0.03
13.2
Certain litigation charges, net
—
—
—
62
0.7
62
52
0.04
16.1
(Gain)/loss on minority investments(5)
—
—
—
—
—
8
7
0.01
12.5
Certain tax adjustments, net
—
—
—
—
—
—
14
0.01
—
Non-GAAP
$ 9,017
$ 3,166
64.9 %
$ 2,177
24.1 %
$ 2,125
$ 1,750
$ 1.36
17.3 %
Currency impact
(243)
(52)
(0.4)
(67)
(0.1)
(0.04)
Currency Adjusted
$ 8,775
$ 3,114
64.5 %
$ 2,110
24.0 %
$ 1.32
Three months ended January 24, 2025
(in millions, except per share data)
Net
Sales
Cost of
Products
Sold
Gross
Margin
Percent
Operating
Profit
Operating
Profit
Percent
Income
Before
Income
Taxes
Net Income
attributable
to
Medtronic
Diluted
EPS
Effective
Tax Rate
GAAP
$ 8,292
$ 2,779
66.5 %
$ 1,646
19.9 %
$ 1,540
$ 1,294
$ 1.01
15.4 %
Non-GAAP Adjustments:
Amortization of intangible assets
—
—
—
416
5.0
416
339
0.26
18.5
Restructuring and associated costs(3)
—
(4)
—
46
0.6
46
37
0.03
19.6
Acquisition and divestiture-related items(4)
—
(1)
—
28
0.3
28
23
0.02
17.9
Certain litigation charges, net
—
—
—
22
0.3
22
18
0.01
22.7
(Gain)/loss on minority investments(5)
—
—
—
—
—
68
52
0.04
22.1
Medical device regulations(6)
—
(8)
0.1
11
0.1
11
9
0.01
18.2
Certain tax adjustments, net
—
—
—
—
—
—
15
0.01
—
Non-GAAP
$ 8,292
$ 2,766
66.6 %
$ 2,169
26.2 %
$ 2,130
$ 1,787
$ 1.39
15.7 %
| See description of non-GAAP financial measures contained in the press release dated February 17, 2026. | |
| (1) | The data in this schedule has been intentionally rounded to the nearest million or $0.01 for EPS figures, and, therefore, may not sum. |
| (2) | The Company recognized $30 million of accelerated amortization on certain intangible assets within the Cardiovascular Portfolio. |
| (3) | The charges primarily relate to employee termination benefits, facility related and contract termination costs, and asset write offs. |
| (4) | The charges primarily include business combination costs, changes in fair value of contingent consideration, exit of business-related charges, and gains related to certain business or asset sales. Exit of business-related charges primarily relate to the impending separation of the Diabetes business. For the three months ended January 23, 2026, charges also include costs associated with the Company's June 2021 decision to stop the distribution and sale of the Medtronic HVAD System. |
| (5) | We exclude unrealized and realized gains and losses on our minority investments as we do not believe that these components of income or expense have a direct correlation to our ongoing or future business operations. |
| (6) | The charges represent incremental costs of complying with the new European Union (E.U.) medical device regulations for previously registered products and primarily include charges for contractors supporting the project and other direct third-party expenses. We consider these costs to be duplicative of previously incurred costs and/or one-time costs. |
See description of non-GAAP financial measures contained in the press release dated February 17, 2026.
(1)
The data in this schedule has been intentionally rounded to the nearest million or $0.01 for EPS figures, and, therefore, may not sum.
(2)
The Company recognized $30 million of accelerated amortization on certain intangible assets within the Cardiovascular Portfolio.
(3)
The charges primarily relate to employee termination benefits, facility related and contract termination costs, and asset write offs.
(4)
The charges primarily include business combination costs, changes in fair value of contingent consideration, exit of business-related charges, and gains related to certain business or asset sales. Exit of business-related charges primarily relate to the impending separation of the Diabetes business. For the three months ended January 23, 2026, charges also include costs associated with the Company's June 2021 decision to stop the distribution and sale of the Medtronic HVAD System.
(5)
We exclude unrealized and realized gains and losses on our minority investments as we do not believe that these components of income or expense have a direct correlation to our ongoing or future business operations.
(6)
The charges represent incremental costs of complying with the new European Union (E.U.) medical device regulations for previously registered products and primarily include charges for contractors supporting the project and other direct third-party expenses. We consider these costs to be duplicative of previously incurred costs and/or one-time costs.
| MEDTRONIC PLC GAAP TO NON-GAAP RECONCILIATIONS(1) (Unaudited) | |||||||||||||||||
| Nine months ended January 23, 2026 | |||||||||||||||||
| (in millions, except per share data) | Net | Cost of | Gross | Operating | Operating | Income | Net Income | Diluted | Effective | ||||||||
| GAAP | $ 26,557 | $ 9,323 | 64.9 % | $ 4,594 | 17.3 % | $ 4,302 | $ 3,557 | $ 2.76 | 16.8 % | ||||||||
| Non-GAAP Adjustments: | |||||||||||||||||
| Amortization of intangible assets(2) | — | — | — | 1,364 | 5.2 | 1,364 | 1,110 | 0.86 | 18.6 | ||||||||
| Restructuring and associated costs(3) | — | (105) | 0.4 | 251 | 1.0 | 251 | 202 | 0.16 | 19.5 | ||||||||
| Acquisition and divestiture-related items(4) | — | (21) | — | 96 | 0.4 | 96 | 73 | 0.06 | 24.0 | ||||||||
| Certain litigation charges, net | — | — | — | 89 | 0.3 | 89 | 73 | 0.06 | 19.1 | ||||||||
| (Gain)/loss on minority investments(5) | — | — | — | — | — | 145 | 137 | 0.11 | 5.5 | ||||||||
| Other(6) | (39) | — | — | (39) | (0.1) | (39) | (30) | (0.02) | 20.5 | ||||||||
| Certain tax adjustments, net(7) | — | — | — | — | — | — | — | — | — | ||||||||
| Non-GAAP | $ 26,518 | $ 9,197 | 65.3 % | $ 6,356 | 24.0 % | $ 6,209 | $ 5,122 | $ 3.98 | 17.2 % | ||||||||
| Currency impact | (513) | (48) | (0.5) | (170) | (0.2) | (0.10) | |||||||||||
| Currency Adjusted | $ 26,005 | $ 9,149 | 64.8 % | $ 6,185 | 23.8 % | $ 3.88 | |||||||||||
| Nine months ended January 24, 2025 | |||||||||||||||||
| (in millions, except per share data) | Net | Cost of | Gross | Operating | Operating | Income | Net Income | Diluted | Effective | ||||||||
| GAAP | $ 24,610 | $ 8,485 | 65.5 % | $ 4,519 | 18.4 % | $ 4,367 | $ 3,606 | $ 2.79 | 16.9 % | ||||||||
| Non-GAAP Adjustments: | |||||||||||||||||
| Amortization of intangible assets | — | — | — | 1,243 | 4.9 | 1,243 | 1,017 | 0.79 | 18.3 | ||||||||
| Restructuring and associated costs(3) | — | (24) | 0.1 | 154 | 0.6 | 154 | 124 | 0.10 | 19.5 | ||||||||
| Acquisition and divestiture-related items(4) | — | (17) | — | 15 | 0.1 | 15 | 3 | — | 73.3 | ||||||||
| Certain litigation charges, net | — | — | — | 104 | 0.4 | 104 | 86 | 0.07 | 17.3 | ||||||||
| (Gain)/loss on minority investments(5) | — | — | — | — | — | 41 | 14 | 0.01 | 61.0 | ||||||||
| Medical device regulations(8) | — | (27) | 0.1 | 38 | 0.2 | 38 | 30 | 0.02 | 21.1 | ||||||||
| Other(6) | 90 | — | 0.2 | 90 | 0.4 | 90 | 70 | 0.05 | 22.2 | ||||||||
| Certain tax adjustments, net(7) | — | — | — | — | — | — | 49 | 0.04 | — | ||||||||
| Non-GAAP | $ 24,700 | $ 8,417 | 65.9 % | $ 6,162 | 24.9 % | $ 6,051 | $ 4,999 | $ 3.87 | 17.0 % | ||||||||
MEDTRONIC PLC
GAAP TO NON-GAAP RECONCILIATIONS(1)
(Unaudited)
Nine months ended January 23, 2026
(in millions, except per share data)
Net
Sales
Cost of
Products
Sold
Gross
Margin
Percent
Operating
Profit
Operating
Profit
Percent
Income
Before
Income
Taxes
Net Income
attributable
to Medtronic
Diluted
EPS
Effective
Tax Rate
GAAP
$ 26,557
$ 9,323
64.9 %
$ 4,594
17.3 %
$ 4,302
$ 3,557
$ 2.76
16.8 %
Non-GAAP Adjustments:
Amortization of intangible assets(2)
—
—
—
1,364
5.2
1,364
1,110
0.86
18.6
Restructuring and associated costs(3)
—
(105)
0.4
251
1.0
251
202
0.16
19.5
Acquisition and divestiture-related items(4)
—
(21)
—
96
0.4
96
73
0.06
24.0
Certain litigation charges, net
—
—
—
89
0.3
89
73
0.06
19.1
(Gain)/loss on minority investments(5)
—
—
—
—
—
145
137
0.11
5.5
Other(6)
(39)
—
—
(39)
(0.1)
(39)
(30)
(0.02)
20.5
Certain tax adjustments, net(7)
—
—
—
—
—
—
—
—
—
Non-GAAP
$ 26,518
$ 9,197
65.3 %
$ 6,356
24.0 %
$ 6,209
$ 5,122
$ 3.98
17.2 %
Currency impact
(513)
(48)
(0.5)
(170)
(0.2)
(0.10)
Currency Adjusted
$ 26,005
$ 9,149
64.8 %
$ 6,185
23.8 %
$ 3.88
Nine months ended January 24, 2025
(in millions, except per share data)
Net
Sales
Cost of
Products
Sold
Gross
Margin
Percent
Operating
Profit
Operating
Profit
Percent
Income
Before
Income
Taxes
Net Income
attributable
to Medtronic
Diluted
EPS
Effective
Tax Rate
GAAP
$ 24,610
$ 8,485
65.5 %
$ 4,519
18.4 %
$ 4,367
$ 3,606
$ 2.79
16.9 %
Non-GAAP Adjustments:
Amortization of intangible assets
—
—
—
1,243
4.9
1,243
1,017
0.79
18.3
Restructuring and associated costs(3)
—
(24)
0.1
154
0.6
154
124
0.10
19.5
Acquisition and divestiture-related items(4)
—
(17)
—
15
0.1
15
3
—
73.3
Certain litigation charges, net
—
—
—
104
0.4
104
86
0.07
17.3
(Gain)/loss on minority investments(5)
—
—
—
—
—
41
14
0.01
61.0
Medical device regulations(8)
—
(27)
0.1
38
0.2
38
30
0.02
21.1
Other(6)
90
—
0.2
90
0.4
90
70
0.05
22.2
Certain tax adjustments, net(7)
—
—
—
—
—
—
49
0.04
—
Non-GAAP
$ 24,700
$ 8,417
65.9 %
$ 6,162
24.9 %
$ 6,051
$ 4,999
$ 3.87
17.0 %
| See description of non-GAAP financial measures contained in the press release dated February 17, 2026. | |
| (1) | The data in this schedule has been intentionally rounded to the nearest million or $0.01 for EPS figures, and, therefore, may not sum. |
| (2) | The Company recognized $121 million of accelerated amortization on certain intangible assets within the Cardiovascular Portfolio. |
| (3) | The charges primarily relate to employee termination benefits, facility related and contract termination costs, and asset write offs. |
| (4) | The charges primarily include business combination costs, changes in fair value of contingent consideration, exit of business-related charges, and gains related to certain business or asset sales. Exit of business-related charges primarily relate to the impending separation of the Diabetes business and costs associated with the Company's June 2021 decision to stop the distribution and sale of the Medtronic HVAD System. |
| (5) | We exclude unrealized and realized gains and losses on our minority investments as we do not believe that these components of income or expense have a direct correlation to our ongoing or future business operations. |
| (6) | Reflects adjustments to the Company's Italian payback accruals resulting from the two July 22, 2024 rulings by the Constitutional Court and the Legislative Decree published by the Italian government on June 30, 2025 for certain prior years since 2015. |
| (7) | The charges for the nine months ended January 23, 2026 primarily includes a tax benefit recognized due to a change in interest accrued on uncertain tax positions, offset by amortization of previously established deferred tax assets arising from intercompany intellectual property transactions. The charges for the nine months ended January 24, 2025 primarily includes amortization of previously established deferred tax assets arising from intercompany intellectual property transactions. |
| (8) | The charges represent incremental costs of complying with the new European Union (E.U.) medical device regulations for previously registered products and primarily include charges for contractors supporting the project and other direct third-party expenses. We consider these costs to be duplicative of previously incurred costs and/or one-time costs. |
See description of non-GAAP financial measures contained in the press release dated February 17, 2026.
(1)
The data in this schedule has been intentionally rounded to the nearest million or $0.01 for EPS figures, and, therefore, may not sum.
(2)
The Company recognized $121 million of accelerated amortization on certain intangible assets within the Cardiovascular Portfolio.
(3)
The charges primarily relate to employee termination benefits, facility related and contract termination costs, and asset write offs.
(4)
The charges primarily include business combination costs, changes in fair value of contingent consideration, exit of business-related charges, and gains related to certain business or asset sales. Exit of business-related charges primarily relate to the impending separation of the Diabetes business and costs associated with the Company's June 2021 decision to stop the distribution and sale of the Medtronic HVAD System.
(5)
We exclude unrealized and realized gains and losses on our minority investments as we do not believe that these components of income or expense have a direct correlation to our ongoing or future business operations.
(6)
Reflects adjustments to the Company's Italian payback accruals resulting from the two July 22, 2024 rulings by the Constitutional Court and the Legislative Decree published by the Italian government on June 30, 2025 for certain prior years since 2015.
(7)
The charges for the nine months ended January 23, 2026 primarily includes a tax benefit recognized due to a change in interest accrued on uncertain tax positions, offset by amortization of previously established deferred tax assets arising from intercompany intellectual property transactions. The charges for the nine months ended January 24, 2025 primarily includes amortization of previously established deferred tax assets arising from intercompany intellectual property transactions.
(8)
The charges represent incremental costs of complying with the new European Union (E.U.) medical device regulations for previously registered products and primarily include charges for contractors supporting the project and other direct third-party expenses. We consider these costs to be duplicative of previously incurred costs and/or one-time costs.
| MEDTRONIC PLC GAAP TO NON-GAAP RECONCILIATIONS(1) (Unaudited) | |||||||||||||||
| Three months ended January 23, 2026 | |||||||||||||||
| (in millions) | Net Sales | SG&A | SG&A | R&D | R&D | Other | Other | Other Non- | |||||||
| GAAP | $ 9,017 | $ 2,956 | 32.8 % | $ 722 | 8.0 % | $ 35 | 0.4 % | $ (121) | |||||||
| Non-GAAP Adjustments: | |||||||||||||||
| Restructuring and associated costs(2) | — | (6) | (0.1) | — | — | — | — | — | |||||||
| Acquisition and divestiture-related items(3) | — | (35) | (0.4) | — | — | 3 | — | — | |||||||
| (Gain)/loss on minority investments(4) | — | — | — | — | — | — | — | (8) | |||||||
| Non-GAAP | $ 9,017 | $ 2,914 | 32.3 % | $ 722 | 8.0 % | $ 38 | 0.4 % | $ (130) | |||||||
| Nine months ended January 23, 2026 | |||||||||||||||
| (in millions) | Net Sales | SG&A | SG&A | R&D | R&D | Other | Other | Other Non- | |||||||
| GAAP | $ 26,557 | $ 8,727 | 32.9 % | $ 2,202 | 8.3 % | $ 126 | 0.5 % | $ (247) | |||||||
| Non-GAAP Adjustments: | |||||||||||||||
| Restructuring and associated costs(2) | — | (15) | — | — | — | — | — | — | |||||||
| Acquisition and divestiture-related items(3) | — | (96) | (0.3) | — | — | 21 | 0.1 | — | |||||||
| Other(5) | (39) | — | — | — | — | — | — | — | |||||||
| (Gain)/loss on minority investments(4) | — | — | — | — | — | — | — | (145) | |||||||
| Non-GAAP | $ 26,518 | $ 8,616 | 32.5 % | $ 2,202 | 8.3 % | $ 147 | 0.6 % | $ (392) | |||||||
MEDTRONIC PLC
GAAP TO NON-GAAP RECONCILIATIONS(1)
(Unaudited)
Three months ended January 23, 2026
(in millions)
Net Sales
SG&A
Expense
SG&A
Expense as
a % of Net
Sales
R&D
Expense
R&D
Expense
as a % of
Net Sales
Other
Operating
(Income)
Expense,
net
Other
Operating
(Inc.)/Exp.,
net as a % of
Net Sales
Other Non-
Operating
Income, net
GAAP
$ 9,017
$ 2,956
32.8 %
$ 722
8.0 %
$ 35
0.4 %
$ (121)
Non-GAAP Adjustments:
Restructuring and associated costs(2)
—
(6)
(0.1)
—
—
—
—
—
Acquisition and divestiture-related items(3)
—
(35)
(0.4)
—
—
3
—
—
(Gain)/loss on minority investments(4)
—
—
—
—
—
—
—
(8)
Non-GAAP
$ 9,017
$ 2,914
32.3 %
$ 722
8.0 %
$ 38
0.4 %
$ (130)
Nine months ended January 23, 2026
(in millions)
Net Sales
SG&A
Expense
SG&A
Expense as
a % of Net
Sales
R&D
Expense
R&D
Expense
as a % of
Net Sales
Other
Operating
(Income)
Expense,
net
Other
Operating
(Inc.)/Exp.,
net as a % of
Net Sales
Other Non-
Operating
Income, net
GAAP
$ 26,557
$ 8,727
32.9 %
$ 2,202
8.3 %
$ 126
0.5 %
$ (247)
Non-GAAP Adjustments:
Restructuring and associated costs(2)
—
(15)
—
—
—
—
—
—
Acquisition and divestiture-related items(3)
—
(96)
(0.3)
—
—
21
0.1
—
Other(5)
(39)
—
—
—
—
—
—
—
(Gain)/loss on minority investments(4)
—
—
—
—
—
—
—
(145)
Non-GAAP
$ 26,518
$ 8,616
32.5 %
$ 2,202
8.3 %
$ 147
0.6 %
$ (392)
| See description of non-GAAP financial measures contained in the press release dated February 17, 2026. | |
| (1) | The data in this schedule has been intentionally rounded to the nearest million, and, therefore, may not sum. |
| (2) | The charges primarily relate to employee termination benefits, facility related and contract termination costs, and asset write offs. |
| (3) | The charges primarily include business combination costs, changes in fair value of contingent consideration, exit of business-related charges, and gains related to certain business or asset sales. Exit of business-related charges primarily relate to the impending separation of the Diabetes business and costs associated with the Company's June 2021 decision to stop the distribution and sale of the Medtronic HVAD System. |
| (4) | We exclude unrealized and realized gains and losses on our minority investments as we do not believe that these components of income or expense have a direct correlation to our ongoing or future business operations. |
| (5) | Reflects adjustments to the Company's Italian payback accruals resulting from the Legislative Decree published by the Italian government on June 30, 2025 for certain prior years since 2015. |
See description of non-GAAP financial measures contained in the press release dated February 17, 2026.
(1)
The data in this schedule has been intentionally rounded to the nearest million, and, therefore, may not sum.
(2)
The charges primarily relate to employee termination benefits, facility related and contract termination costs, and asset write offs.
(3)
The charges primarily include business combination costs, changes in fair value of contingent consideration, exit of business-related charges, and gains related to certain business or asset sales. Exit of business-related charges primarily relate to the impending separation of the Diabetes business and costs associated with the Company's June 2021 decision to stop the distribution and sale of the Medtronic HVAD System.
(4)
We exclude unrealized and realized gains and losses on our minority investments as we do not believe that these components of income or expense have a direct correlation to our ongoing or future business operations.
(5)
Reflects adjustments to the Company's Italian payback accruals resulting from the Legislative Decree published by the Italian government on June 30, 2025 for certain prior years since 2015.
| MEDTRONIC PLC GAAP TO NON-GAAP RECONCILIATIONS(1) (Unaudited) | |||
| Nine months ended | |||
| (in millions) | January 23, 2026 | January 24, 2025 | |
| Net cash provided by operating activities | $ 4,757 | $ 4,516 | |
| Additions to property, plant, and equipment | (1,416) | (1,400) | |
| Free Cash Flow(2) | $ 3,341 | $ 3,116 | |
MEDTRONIC PLC
GAAP TO NON-GAAP RECONCILIATIONS(1)
(Unaudited)
Nine months ended
(in millions)
January 23, 2026
January 24, 2025
Net cash provided by operating activities
$ 4,757
$ 4,516
Additions to property, plant, and equipment
(1,416)
(1,400)
Free Cash Flow(2)
$ 3,341
$ 3,116
| See description of non-GAAP financial measures contained in the press release dated February 17, 2026. | |
| (1) | The data in this schedule has been intentionally rounded to the nearest million, and, therefore, may not sum. |
| (2) | Free cash flow represents operating cash flows less property, plant, and equipment additions. |
See description of non-GAAP financial measures contained in the press release dated February 17, 2026.
(1)
The data in this schedule has been intentionally rounded to the nearest million, and, therefore, may not sum.
(2)
Free cash flow represents operating cash flows less property, plant, and equipment additions.
| MEDTRONIC PLC CONSOLIDATED STATEMENTS OF CASH FLOWS (Unaudited) | |||
| Nine months ended | |||
| (in millions) | January 23, 2026 | January 24, 2025 | |
| Operating Activities: | |||
| Net income | $ 3,578 | $ 3,630 | |
| Adjustments to reconcile net income to net cash provided by operating activities: | |||
| Depreciation and amortization | 2,242 | 2,021 | |
| Provision for credit losses | 102 | 96 | |
| Deferred income taxes | 59 | (81) | |
| Stock-based compensation | 362 | 340 | |
| Other, net | 280 | 14 | |
| Change in operating assets and liabilities, net of acquisitions and divestitures: | |||
| Accounts receivable, net | 87 | (184) | |
| Inventories | (803) | (478) | |
| Accounts payable and accrued liabilities | (77) | (157) | |
| Other operating assets and liabilities | (1,074) | (685) | |
| Net cash provided by operating activities | 4,757 | 4,516 | |
| Investing Activities: | |||
| Acquisitions, net of cash acquired | — | (98) | |
| Additions to property, plant, and equipment | (1,416) | (1,400) | |
| Purchases of investments | (6,572) | (6,093) | |
| Sales and maturities of investments | 5,982 | 6,255 | |
| Other investing activities, net | (10) | (111) | |
| Net cash used in investing activities | (2,017) | (1,447) | |
| Financing Activities: | |||
| Change in current debt obligations, net | 173 | (1,070) | |
| Issuance of long-term debt | 1,747 | 3,209 | |
| Payments on long-term debt | (2,930) | — | |
| Dividends to shareholders | (2,731) | (2,692) | |
| Issuance of ordinary shares | 419 | 400 | |
| Repurchase of ordinary shares | (600) | (2,961) | |
| Other financing activities, net | 60 | 96 | |
| Net cash used in financing activities | (3,863) | (3,018) | |
| Effect of exchange rate changes on cash and cash equivalents | 52 | (95) | |
| Net change in cash and cash equivalents | (1,072) | (44) | |
| Cash and cash equivalents at beginning of period | 2,218 | 1,284 | |
| Cash and cash equivalents at end of period | $ 1,147 | $ 1,240 | |
| Supplemental Cash Flow Information | |||
| Cash paid for: | |||
| Income taxes | $ 1,598 | $ 1,515 | |
| Interest | 573 | 567 | |
MEDTRONIC PLC
CONSOLIDATED STATEMENTS OF CASH FLOWS
(Unaudited)
Nine months ended
(in millions)
January 23, 2026
January 24, 2025
Operating Activities:
Net income
$ 3,578
$ 3,630
Adjustments to reconcile net income to net cash provided by operating activities:
Depreciation and amortization
2,242
2,021
Provision for credit losses
102
96
Deferred income taxes
59
(81)
Stock-based compensation
362
340
Other, net
280
14
Change in operating assets and liabilities, net of acquisitions and divestitures:
Accounts receivable, net
87
(184)
Inventories
(803)
(478)
Accounts payable and accrued liabilities
(77)
(157)
Other operating assets and liabilities
(1,074)
(685)
Net cash provided by operating activities
4,757
4,516
Investing Activities:
Acquisitions, net of cash acquired
—
(98)
Additions to property, plant, and equipment
(1,416)
(1,400)
Purchases of investments
(6,572)
(6,093)
Sales and maturities of investments
5,982
6,255
Other investing activities, net
(10)
(111)
Net cash used in investing activities
(2,017)
(1,447)
Financing Activities:
Change in current debt obligations, net
173
(1,070)
Issuance of long-term debt
1,747
3,209
Payments on long-term debt
(2,930)
—
Dividends to shareholders
(2,731)
(2,692)
Issuance of ordinary shares
419
400
Repurchase of ordinary shares
(600)
(2,961)
Other financing activities, net
60
96
Net cash used in financing activities
(3,863)
(3,018)
Effect of exchange rate changes on cash and cash equivalents
52
(95)
Net change in cash and cash equivalents
(1,072)
(44)
Cash and cash equivalents at beginning of period
2,218
1,284
Cash and cash equivalents at end of period
$ 1,147
$ 1,240
Supplemental Cash Flow Information
Cash paid for:
Income taxes
$ 1,598
$ 1,515
Interest
573
567
| The data in this schedule has been intentionally rounded to the nearest million, and, therefore, may not sum. |
The data in this schedule has been intentionally rounded to the nearest million, and, therefore, may not sum.
PDF - https://mma.prnewswire.com/media/2904972/Earnings_Presentation_FY26Q3_Final.pdf
PDF - https://mma.prnewswire.com/media/2904973/Exhibit_99_1___FY26_Q3_Earnings_Release_2_16.pdf
** The press release content is from PR Newswire. Bastille Post is not involved in its creation. **
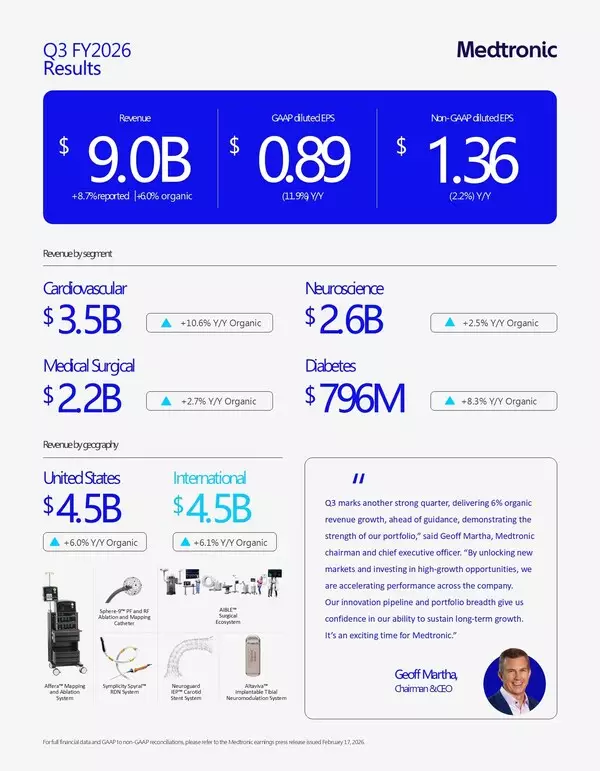
Medtronic reports strong third quarter fiscal 2026 results with highest enterprise revenue growth in 10 quarters