Hong Kong Customs detects dangerous drugs case and seizes suspected drugs worth about $2.3 million
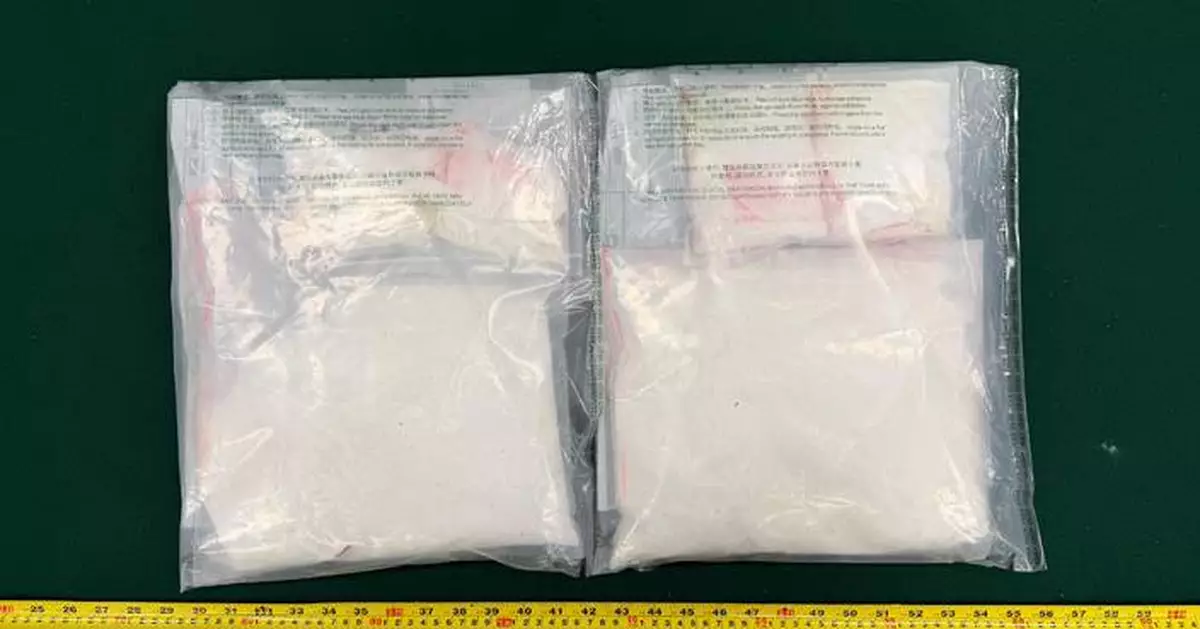
Hong Kong Customs detected a dangerous drugs case yesterday (April 27), and seized a total of about 3 kilograms of suspected cocaine, with an estimated market value of about $2.3 million. One person suspected to be connected with the case was arrested.
Hong Kong Customs and Mainlanddepartments on narcotics control and anti-smuggling carried out an intelligence exchange, and intercepted two parcels from the Chinese Mainland on April 25, declared as books and clothing, and discovered the batch of suspected cocaine concealed inside the false compartments of a suitcase in one of the parcels. Upon follow-up investigations, Customs officers conducted a controlled delivery operation and arrested a 41-year-old non-local woman in Mong Kok yesterday.
The arrested person has been charged with one count of trafficking in a dangerous drug. The case will be brought up at the Kowloon City Magistrates' Courts tomorrow (April 29).
Under the Dangerous Drugs Ordinance, trafficking in a dangerous drug is a serious offence. The maximum penalty upon conviction is a fine of $5 million and life imprisonment.
Members of the public may report any suspected drug trafficking activities to Customs' 24-hour hotline 182 8080 or its dedicated crime-reporting email account (crimereport@customs.gov.hk) or online form (eform.cefs.gov.hk/form/ced002).
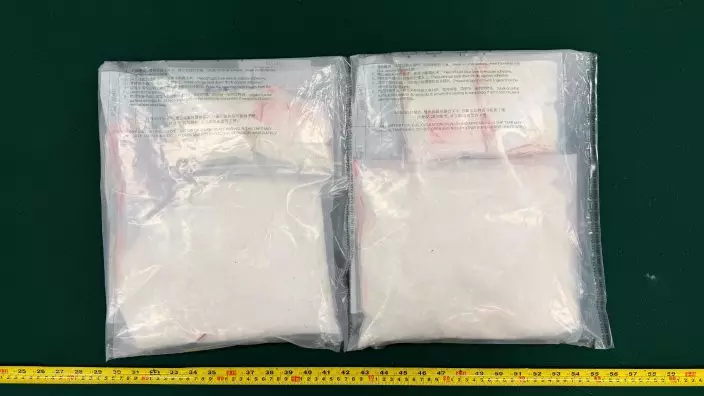
Hong Kong Customs detected a dangerous drugs case yesterday (April 27), and seized a total of about 3 kilograms of suspected cocaine, with an estimated market value of about $2.3 million. One person suspected to be connected with the case was arrested. Photo shows the suspected cocaine seized. Source: HKSAR Government Press Releases
SITI to attend APEC Digital and AI Ministerial Meeting and other Digital Weeks high-level events in Chengdu
The Secretary for Innovation, Technology and Industry, Professor Sun Dong, will depart for Chengdu this morning (July 22) to attend the Asia-Pacific Economic Cooperation (APEC) Digital and AI Ministerial Meeting (DMM) and other high-level events during the APEC Digital Weeks.
The theme of this year's DMM is "Digital and AI Technologies for Empowerment of the Asia-Pacific Community". Professor Sun will speak at thematic sessions, introducing Hong Kong's initiatives and achievements in promoting innovation and technology (I&T) development, digital transformation and smart upgrades, as well as sharing the city's progress in promoting digital inclusion and enhancing digital literacy and competency of the community.
Professor Sun will also attend other Digital Weeks high-level events, including the High-Level Forum on AI, the High-Level Roundtable on Data for Growth, the High-level Dialogue: Leveraging Digital and AI Technologies to Empower the APEC Community, and the Workshop on New Concepts and Approaches of AI Literacy Enhancement Actions for the Public. He will deliver speeches and participate in discussions at these events.
During his visit, Professor Sun will also meet and exchange views with senior officials responsible for information technology from other APEC member economies and local government officials, as well as visit a local university, a digital economy service platform and I&T enterprises.
Professor Sun will return to Hong Kong in the afternoon of July 26. During his absence, the Under Secretary for Innovation, Technology and Industry, Ms Lillian Cheong, will be the Acting Secretary for Innovation, Technology and Industry.

Source: AI-found images