
WINDSOR, Conn.--(BUSINESS WIRE)--Jul 14, 2026--
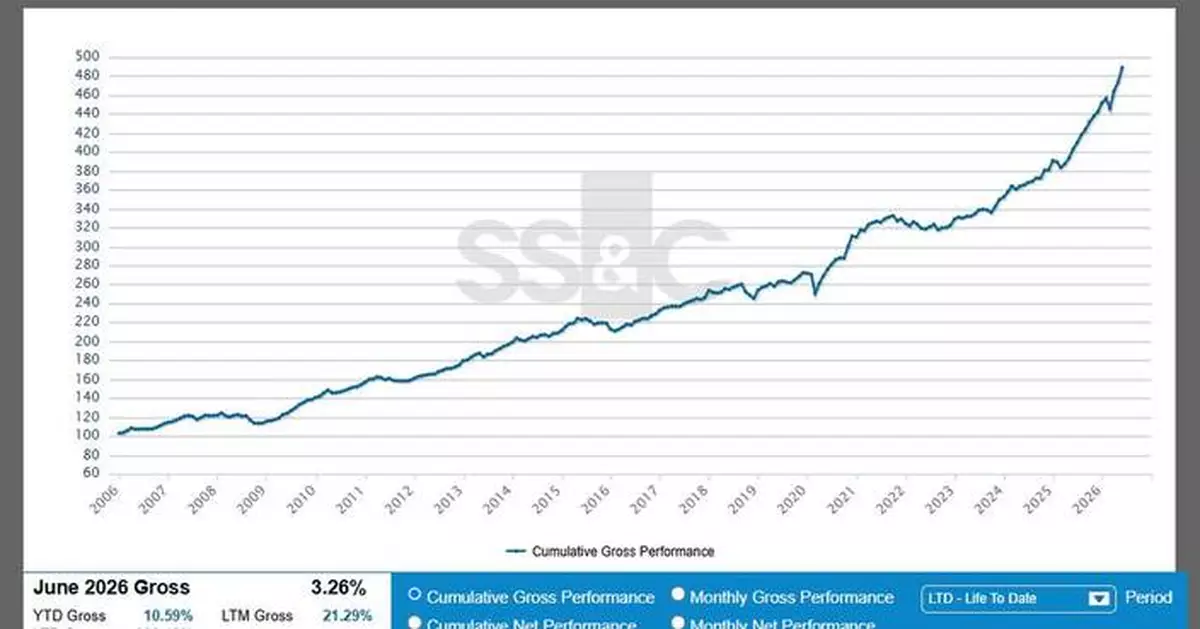
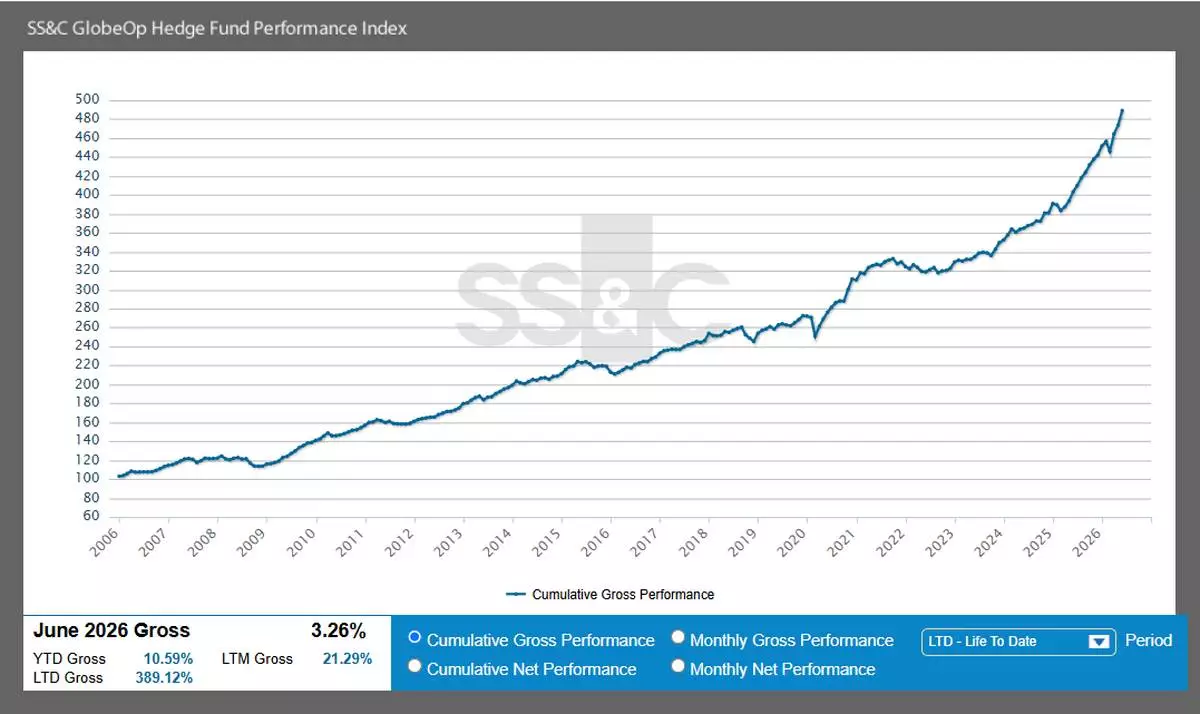
SS&C Technologies Holdings, Inc. (Nasdaq: SSNC) today announced the gross return of the SS&C GlobeOp Hedge Fund Performance Index for June 2026 measured 3.26%.
This press release features multimedia. View the full release here: https://www.businesswire.com/news/home/20260714237023/en/
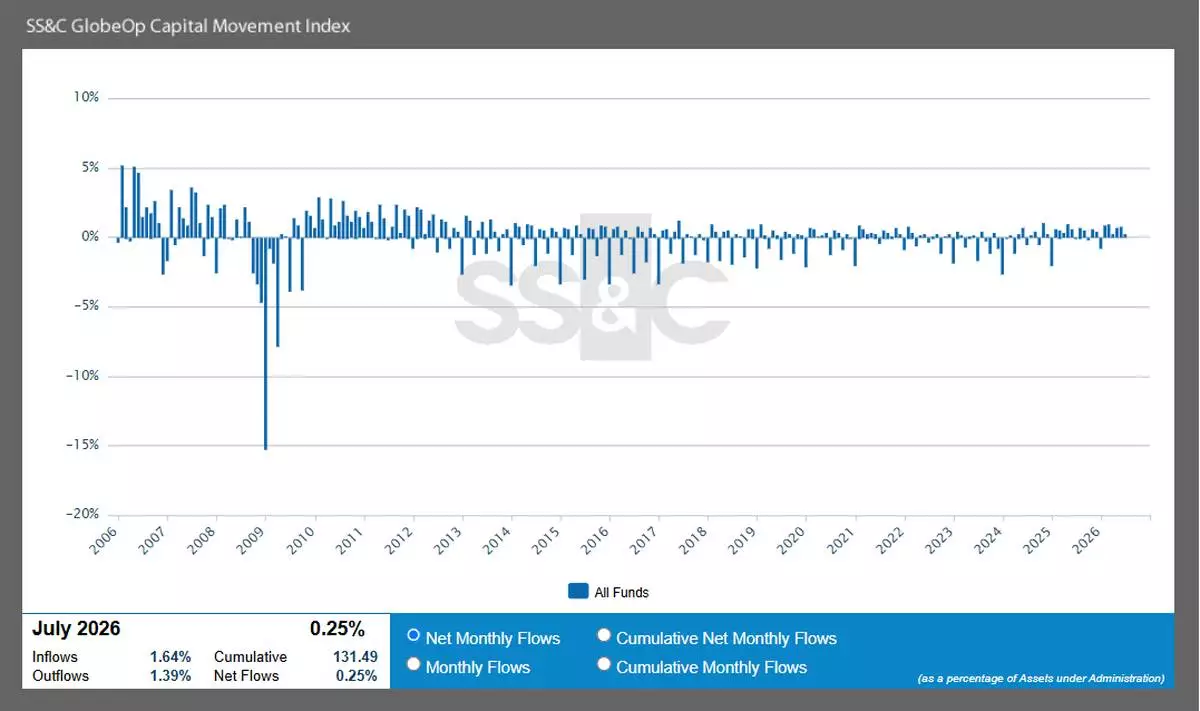
Hedge fund flows as measured by the SS&C GlobeOp Capital Movement Index advanced 0.25% in July.
"SS&C GlobeOp's Capital Movement Index for July 2026 was 0.25%, marking six straight months of positive inflows. Notably, July flows are typically negative due to quarterly portfolio rebalancing and asset allocation shifts," said Bill Stone, Chairman and CEO of SS&C Technologies. "Despite ongoing conflicts and global market turbulence, investors continue to view hedge funds as a durable strategy offering steadier less correlated returns."
SS&C GlobeOp Hedge Fund Performance Index
The SS&C GlobeOp Hedge Fund Performance Index is an asset-weighted, independent monthly window on hedge fund performance. On the ninth business day of each month it provides a flash estimate of the gross aggregate performance of funds for which SS&C GlobeOp provides monthly administration services on the SS&C GlobeOp platform. Interim and final values, both gross and net, are provided in each of the two following months, respectively. Online data can be segmented by gross and net performance, and by time periods. The SS&C GlobeOp Hedge Fund Performance Index is transparent, consistent in data processing, and free from selection or survivorship bias. Its inception date is January 1, 2006.
The SS&C GlobeOp Hedge Fund Performance Index offers a unique reflection of the return on capital invested in funds. It does not overstate exposure to, or the contribution of, any single strategy to aggregate hedge fund performance. Since its inception, the correlation of the SS&C GlobeOp Performance Index to many popular equity market indices has been approximately 25% to 30%. This is substantially lower than the equivalent correlation of other widely followed hedge fund performance indices.
SS&C GlobeOp Capital Movement Index
The SS&C GlobeOp Capital Movement Index represents the monthly net of hedge fund subscriptions and redemptions administered by SS&C GlobeOp on the SS&C GlobeOp platform. This monthly net is divided by the total assets under administration (AuA) for fund administration clients on the SS&C GlobeOp platform.
Cumulatively, the SS&C GlobeOp Capital Movement Index for July 2026 stands at 131.49 points, an increase of 0.25 points over June 2026. The Index has advanced 5.13 points over the past 12 months. The next publication date is August 13, 2026.
Published on the ninth business day of each month, the SS&C GlobeOp Capital Movement Index presents a timely and accurate view of investments in hedge funds on the SS&C GlobeOp administration platform. Data is based on actual subscriptions and redemptions independently calculated and confirmed from real capital movements, and published only a few business days after they occur. Following the month of its release, the Index may be updated for capital movements that occurred after the fifth business day.
SS&C GlobeOp Hedge Fund Performance Index
SS&C GlobeOp Capital Movement Index
SS&C GlobeOp Forward Redemption Indicator
About the SS&C GlobeOp Hedge Fund Index ®
The SS&C GlobeOp Hedge Fund Index (the Index) is a family of indices published by SS&C GlobeOp. A unique set of indices by a hedge fund administrator, it offers clients, investors and the overall market a welcome transparency on liquidity, investor sentiment and performance. The Index is based on a significant platform of diverse and representative assets.
The SS&C GlobeOp Capital Movement Index and the SS&C GlobeOp Forward Redemption Indicator provide monthly reports based on actual and anticipated capital movement data independently collected from all hedge fund clients for whom SS&C GlobeOp provides administration services on the SS&C GlobeOp platform.
The SS&C GlobeOp Hedge Fund Performance Index is an asset-weighted benchmark of the aggregate performance of funds for which SS&C GlobeOp provides monthly administration services on the SS&C GlobeOp platform. Flash estimate, interim and final values are provided, in each of three months respectively, following each business month-end.
While individual fund data is anonymized by aggregation, the SS&C GlobeOp Hedge Fund Index data will be based on the same reconciled fund data that SS&C GlobeOp uses to produce fund net asset values (NAV). Funds acquired through the acquisition of Citi Alternative Investor Services are integrated into the index suite starting with the January 2017 reporting periods. SS&C GlobeOp’s total assets under administration on the SS&C GlobeOp platform represent approximately 10% of the estimated assets currently invested in the hedge fund sector. The investment strategies of the funds in the indices span a representative industry sample. Data for middle and back office clients who are not fund administration clients is not included in the Index, but is included in the Company’s results announcement figures.
About SS&C Technologies
SS&C is a leading provider of mission-critical, AI-powered software and services empowering financial services and healthcare organizations to work smarter, faster, and securely. Founded in 1986, SS&C is headquartered in Windsor, Connecticut, and has offices worldwide. More than 23,000 financial services and healthcare organizations, from the world's largest companies to small and mid-market firms, rely on SS&C for expertise, scale and technology.
Additional information about SS&C (Nasdaq: SSNC) is available at www.ssctech.com.
Follow SS&C on X, LinkedIn and Facebook.
SS&C GlobeOp Capital Movement Index
SS&C GlobeOp Hedge Fund Performance Index