

VANCOUVER, British Columbia--(BUSINESS WIRE)--Aug 6, 2026--
Northisle Copper and Gold Inc. (TSX-V: NCX, OTCQX: NTCPF) (“Northisle” or the “Company”) is pleased to announce the release of an integrated mineral resource estimate for its 100% owned North Island Project (the “2026 Resource Estimate”), which integrates the Northwest Expo, Red Dog, West Goodspeed, and Hushamu deposits. The 2026 Resource Estimate will be used for the development of a pre-feasibility study (“PFS”) on the North Island Project, which remains on target for completion in Q1 2027.
Click to Gallery
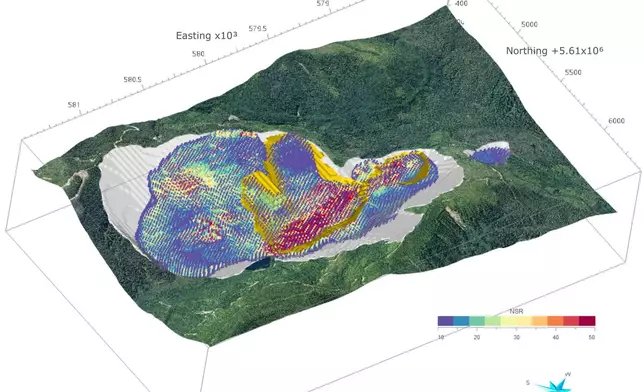
Figure 5: Hushamu Resource Shell and Block Model Showing NSR/tonne. Coordinates are reported in UTM Zone 9 North (NAD83 CRS, VD CVG28BC) with units in metres.
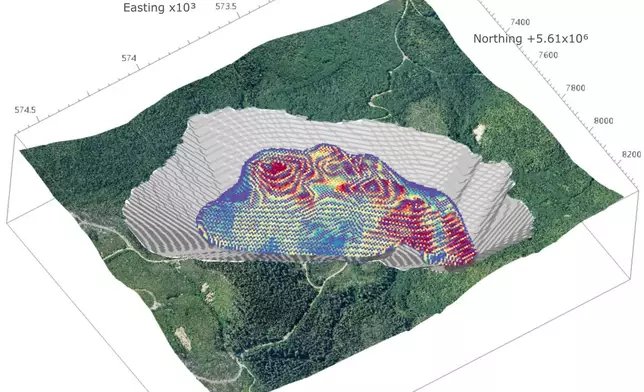
Figure 4: West Goodspeed Resource Shell and Block Model Showing NSR/tonne. Coordinates are reported in UTM Zone 9 North (NAD83 CRS, VD CVG28BC) with units in metres.
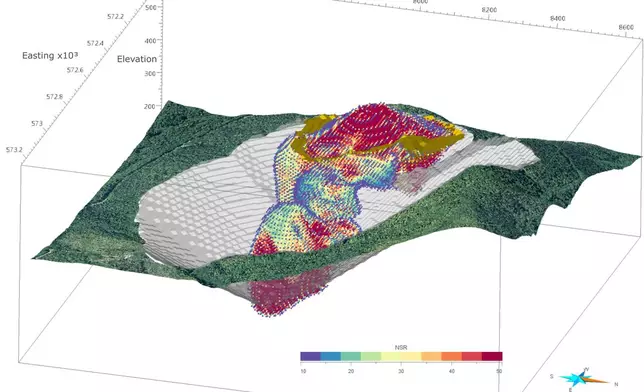
Figure 3: Red Dog Resource Shell and Block Model Showing NSR/tonne. Coordinates are reported in UTM Zone 9 North (NAD83 CRS, VD CVG28BC) with units in metres.
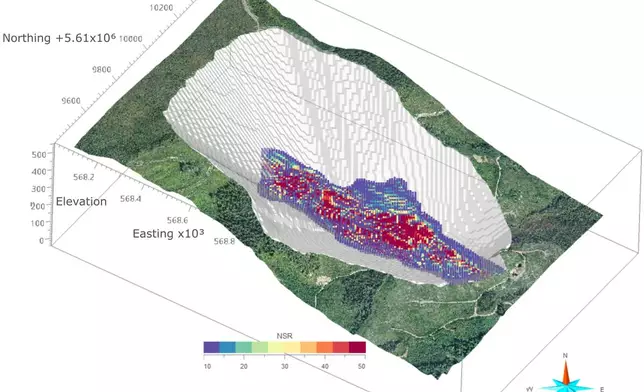
Figure 2: Northwest Expo Resource Shell and Block Model Showing NSR/tonne. Coordinates are reported in UTM Zone 9 North (NAD83 CRS, VD CVG28BC) with units in metres.
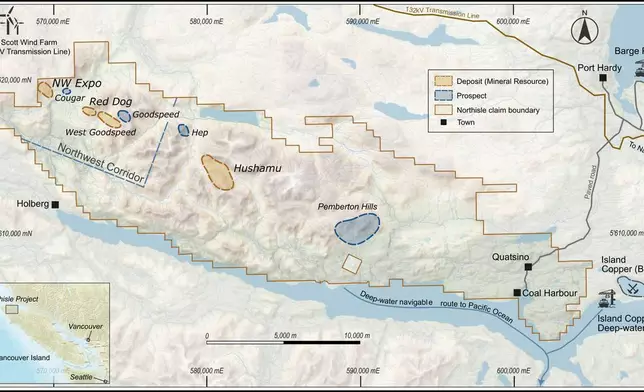
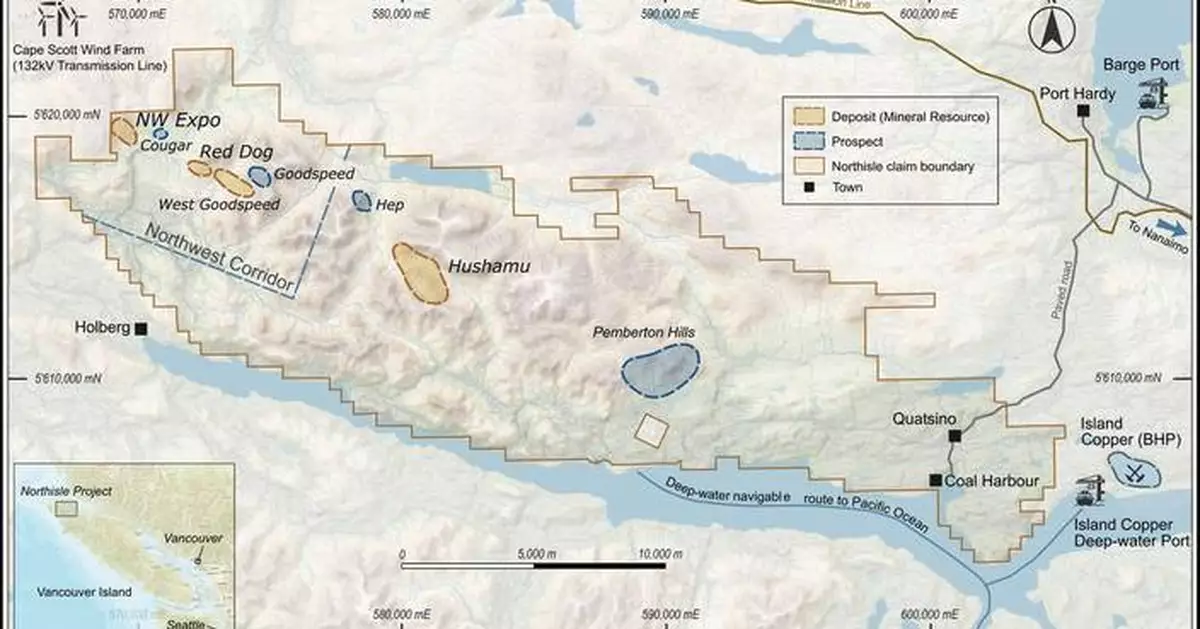
Figure 1: North Island Project Showing Location of Deposits and Prospects. Coordinates are reported in UTM Zone 9 North (NAD83 CRS, VD CVG28BC) with units in metres.
This press release features multimedia. View the full release here: https://www.businesswire.com/news/home/20260806587703/en/
Alex Davidson, Chairman, noted “This integrated resource update represents another important milestone for Northisle and is a critical step towards the completion of the North Island Project PFS. With 10.1 billion pounds of copper equivalent or 16.2 million ounces of gold equivalent contained in Indicated Resources, the 2026 Resource Estimate is finally beginning to tell the story of the district-scale potential of the North Island Project.”
Sam Lee, President & CEO, stated “Over the past 18 months, we have either achieved or exceeded each of the goals we set in respect to resource growth and conversion. At West Goodspeed, we added over 113 million tonnes of Indicated Resources with 873 million lbs Cu Eq., or 1.2 million oz Au Eq. in contained metal. At Northwest Expo, we successfully converted Inferred material, increasing Indicated tonnage by 133%, and expanded the resource along strike. Significantly, at Red Dog, we increased contained copper equivalent metal in Indicated Resources by 30% and plan to investigate the connection between Red Dog and West Goodspeed with additional drilling in 2026. We additionally increased our exposure to critical minerals beyond copper, adding 68 million lbs Mo and 362,000 lbs Re in Indicated Resources. These results, in addition to improved commodity prices, have driven meaningful resource growth and provide a solid foundation for the North Island Project PFS, which remains on target for completion in Q1 2027.”
The 2026 Resource Estimate contains an Indicated Resource of 1.2 billion tonnes grading 0.14% Cu, 0.22 g/t Au, 79.5 ppm Mo and 0.44 ppm Re for total contained metal of 10.1 billion lbs copper equivalent (“Cu Eq.”) or 16.2 million oz gold equivalent (“Au Eq.”) (recovery adjusted), plus an Inferred Resource of 260 million tonnes grading 0.12% Cu, 0.15 g/t Au, 62.0 ppm Mo, and 0.37 ppm Re for total contained metal of 1.5 billion lbs Cu Eq. or 2.6 million oz Au Eq. (recovery adjusted), at an $11.00/tonne NSR cut-off.
Additionally, the 2026 Resource Estimate describes a shallow higher-grade portion of the Hushamu deposit (the “Hushamu Shallow Higher-Grade Core”), which is expected to be included in the first pushback to be extracted from the Hushamu deposit. In aggregate, the deposits comprising the Northwest Corridor, including Northwest Expo, Red Dog, and West Goodspeed, plus the Hushamu Shallow Higher-Grade Core, contain an Indicated Resource of 405 million tonnes grading 0.50% Cu Eq. or 0.46 g/t Au Eq. for total Indicated contained metal of 4.5 billion lbs Cu Eq. or 6.0 million oz Au Eq.
The 2026 Resource Estimate has an effective date of July 31, 2026, and is summarized in Table 1 below by deposit. The 2026 Resource Estimate was prepared by Sue Bird, P.Eng. of Moose Mountain Technical Services (“MMTS”) who is independent of Northisle. Metallurgical test work which is referenced in the Design Basis (as defined below) was completed under the supervision of Peter Mehrfert, P.Eng. of Ausenco Engineering Canada ULC (“Ausenco”). A technical report (the “Technical Report”) prepared in accordance with National Instrument 43-101 – Standards of Disclosure for Mineral Projects (“NI 43-101”) will be filed on the Company’s website and SEDAR+ within 45 days of the date of this press release.
Key assumptions reflected in the 2026 Resource Estimate are detailed below for each deposit and will be further described in the Technical Report. With the release of the 2026 Resource Estimate, the Company’s previous technical reports, including the 2025 North Island Project Preliminary Economic Assessment dated February 12, 2025, are no longer current and should not be relied upon.
The $11.00/tonne NSR cut-off was selected as having reasonable prospects of eventual economic extraction as this value covers preliminary estimated Phase 2 processing and G&A costs as detailed in the Design Basis below. The economic assumptions presented may change during the completion of the ongoing North Island Project PFS.
Mineral resources are not mineral reserves and do not have demonstrated economic viability. There is no certainty that all or any part of the mineral resources will be converted into mineral reserves. Inferred mineral resources are subject to uncertainty as to their existence and as to their economic and legal feasibility. The level of geological uncertainty associated with an inferred mineral resource is too high to apply relevant technical and economic factors likely to influence the prospects of economic extraction in a manner useful for evaluation of economic viability.
These mineral resource estimates include Inferred mineral resources that are considered too speculative geologically to have economic considerations applied to them that would enable them to be categorized as mineral reserves. Mineral Resources that are not Mineral Reserves do not have demonstrated economic viability.
The Qualified Person(s) are of the opinion that issues relating to all relevant technical and economic factors likely to influence the prospects of eventual economic extraction can be resolved with further work. These factors may include environmental permitting, infrastructure, sociopolitical, marketing, or other relevant factors.
Figure 1 shows the location of the deposits within the North Island Project in the context of regional infrastructure.
Exploration and Development Milestones
The Company continues to advance the North Island Project, with multiple near-term development and exploration catalysts including:
Details of Northwest Expo Resource Estimate
The Northwest Expo Resource Estimate includes a total of 61 diamond drill holes totalling 24,966 metres drilled by Northisle and previous operators through the end of 2025, of which 31 holes totalling 10,629 metres were completed under the direction of Northisle between 2024 and 2025.
Table 2 below summarizes the Northwest Expo Resource Estimate and shows the sensitivity of the estimate to cut-off assumptions.
Figure 2 shows the resource pit shell and modelled block grades for the Northwest Expo deposit showing the NSR blocks above the $11.00/tonne cut-off.
Details of Red Dog Resource Estimate
The Red Dog Resource Estimate includes a total of 96 diamond drill holes totalling 21,970 metres drilled by Northisle and previous operators through the end of April 2026, of which 47 holes totalling 12,315 metres of assaying were completed under the direction of Northisle between June 2025 and April 2026.
Table 3 below summarizes the Red Dog Resource Estimate and shows the sensitivity of the estimate to cut-off assumptions.
Table 4 below summarizes the shallow higher-grade core of the Red Dog deposit that is expected to be included in the first pushback of mining from Red Dog. This pit shell is defined by the 30% revenue factor of the base case economic inputs defining the resource pit shell.
Figure 3 shows the resource pit shell (grey) and the low strip-ratio, higher-grade conceptual initial phase (gold) as summarized above. The modelled block grades shown are the NSR blocks above the $11.00/tonne cut-off.
Details of West Goodspeed Resource Estimate
The West Goodspeed Resource Estimate includes a total of 47 diamond drill holes totalling 14,435 metres drilled by Northisle and previous operators through the end of August 2025, of which 38 holes totalling 12,000 metres were completed under the direction of Northisle between 2023 and 2025.
Table 5 below summarizes the West Goodspeed Resource Estimate and shows the sensitivity of the estimate to cut-off assumptions.
Figure 4 shows the resource pit shell and modelled block grades for the West Goodspeed deposit showing the NSR blocks above the $11.00/tonne cut-off.
Details of Hushamu Resource Estimate
The Hushamu Resource Estimate includes a total of 165 diamond drill holes totalling 40,482 metres drilled by Northisle and previous operators through the end of 2022, of which 40 holes totalling 13,345 metres of assaying were completed under the direction of Northisle between 2011 and 2023.
Table 6 below summarizes the Hushamu Resource Estimate and shows the sensitivity of the estimate to cut-off assumptions.
Table 7 below highlights the shallow higher-grade core of the Hushamu deposit that is expected be included in the first pushback to be extracted from this deposit. This pit shell is defined by the 37% revenue factor of the base case economic inputs defining the resource pit shell.
Figure 5 shows the resource pit shell (grey) and the higher-grade, 37% conceptual pit shell (gold) as summarized above. The modelled block grades shown are the NSR blocks above the $11.00/tonne cut-off.
Design Basis
The following Design Basis was established for the purpose of the 2026 Resource Estimate. The economic assumptions presented here may change during the completion of the ongoing North Island Project PFS.
Details of Metallurgical Testing Procedures and Results
The Design Basis is informed by the results of the same metallurgical testing programs that supported the 2025 Preliminary Economic Assessment for the North Island Project (the “2025 PEA”). In connection with the 2025 PEA, Peter Mehrfert, P.Eng., (Ausenco) reviewed and interpreted several metallurgical test programs conducted under the direction of Northisle since 2009. The test programs utilized half drill core samples and were conducted at three metallurgical testing laboratories: ALS Metallurgy (Kamloops, BC), Base Metallurgical (Kamloops, BC) and SGS (Lakefield, ON). Molybdenum recoveries for Northwest Expo and Red Dog were not previously considered for the 2025 PEA; recovery of this metal is now estimated based on testing conducted prior to 2025. Copper recovery for NW Expo was previously estimated as constant values in the 2025 PEA, a variable Cu recovery was applied to conservatively estimate recoveries on lower grade materials.
West Goodspeed drill core samples were tested at Base Metallurgical, starting in 2025. Recoveries for this deposit are estimated based on preliminary results measured on 9 variability samples and one master composite.
Copper-molybdenum separation testing has not yet been completed on samples from any of the deposits. It is assumed that this circuit will recover 90% of the molybdenum contained in the bulk Cu-Mo concentrates and can produce a 50% molybdenum concentrate grade. Both metallurgical performance targets are typical of Cu-Mo separation circuits. Rhenium recovery to a marketable molybdenum concentrate has also not yet been measured. It is estimated that rhenium recovery to the molybdenum concentrate will be 80% of the predicted molybdenum recovery, as this metal typically occurs as a molybdenum substitute in molybdenite.
Additional metallurgical testing programs to support the North Island Project PFS (the “PFS Metallurgical Testing Programs”) are ongoing, with results to be incorporated into the North Island Project PFS. The PFS Metallurgical Testing Programs may yield different results than prior metallurgical testing programs, and Mr. Mehrfert’s review and interpretation of the PFS Metallurgical Testing Programs may result in changes to the Design Basis during the completion of the ongoing North Island Project PFS.
Additional Technical Details
Details of Resource Estimation Methodology
At each deposit, three-dimensional solids have been created of the alteration / lithologies to aid in the orientation and extent of the mineralized domains used to confine the resource grade interpolations.
Cumulative probability plots are used to define capping values of the assays and potential outlier restrictions of the composites during interpolations.
Compositing has been done by three metre intervals honoring the domain boundary for each element. Three meters was selected because it is the length of the longest assays. Values less than 1.5m have been added to the composite above to avoid small composite lengths.
Ordinary Kriging interpolations have been used for Au, Cu, Mo and Re interpolations. Search distances and orientations for each metal are based on the variography and will be fully described in the supporting technical report.
Resource classification is based on the distance between drillholes with criteria based on the variography using the following process.
The classification was adjusted to reduce extrapolation and to ensure continuity as follows:
The modelled tonnage and grades have been validated by comparison of the average grades with the de-clustered composite data and using swath plots, grade-tonnage curves and visual validations on section and in plan.
Additional details on the methodology will be provided in the Technical Report relating to the 2026 Resource Estimate.
Qualified Persons and Data Verification
Sue Bird, P. Eng, V.P. of MMTS, and a Qualified Person as defined by NI 43-101, has reviewed and approved the scientific and technical disclosure contained in this news release relating to the 2026 Resource Estimate. Ms. Bird has verified the data incorporated in the 2026 Resource Estimate by certificate checks, standards, blank and duplicate plots. Ms. Bird experienced no limitations with respect to data verification activities related to the North Island Project.
The information in this press release relating to the metallurgical test work results has been reviewed and verified by Peter Mehrfert, P.Eng., (Ausenco). Mr. Mehrfert is a Qualified Person under NI 43-101. Mr. Mehrfert has verified the metallurgical recoveries incorporated in the 2026 Resource Estimate by reviewing the test data and the laboratory’s QA/QC protocols. Mr. Mehrfert experienced no limitations with respect to data verification activities related to the North Island Project.
Dr. Pablo Mejia Herrera, P.Geo., Vice President Exploration of Northisle, and a Qualified Person as defined by NI 43-101, has reviewed and approved all other scientific and technical disclosure contained in this news release.
About Northisle
Northisle Copper and Gold Inc. is a Vancouver-based company whose vision is to become Canada’s leading sustainable mineral resource company for the future. Northisle, through its 100% owned subsidiary North Island Mining Corp., owns the North Island Project, which is one of the most promising copper and gold porphyry projects in Canada. The North Island Project is located near Port Hardy, British Columbia on a more than 34,000-hectare block of mineral titles 100% owned by Northisle on a belt stretching 50 kilometres northwest from the now closed Island Copper Mine operated by BHP Billiton. Since 2021, the Company has discovered two significant deposits, expanded resources, demonstrated the potential of the North Island Project, and is now focused on the development of this compelling project while exploring within this highly prospective land package.
Northisle respectfully acknowledges that our North Island Project is located within the territories of Quatsino First Nation, Kwakiutl First Nation, and Tlatlasikwala First Nation. We are committed to collaborating with First Nations to build authentic, mutually beneficial relationships.
For more information on Northisle please visit the Company’s website at www.northisle.ca.
Cautionary Statements regarding Forward-Looking Information
Certain information in this news release constitutes forward-looking statements under applicable securities law. Any statements that are contained in this news release that are not statements of historical fact may be deemed to be forward-looking statements. Forward-looking statements are often identified by terms such as “may”, “should”, “anticipate”, “expect”, “intend” and similar expressions. Forward-looking statements in this news release include, but are not limited to: plans and expectations regarding the 2026 exploration program; plans and expectations regarding future project development; timing of key catalysts; planned activities, including further drilling, at the North Island Project and the North Island Pre-feasibility Study; anticipated impact of drilling results from West Goodspeed, Northwest Expo, Red Dog and other targets on Mineral Resource Estimates; the Company’s anticipated exploration activities; the timing of the filing of the Technical Report in respect of the 2026 Resource Estimate; the timing, completion and results of the Pre-feasibility Study; the Design Basis and economic assumptions, including the NSR cut-off grade, used in the 2026 Resource Estimate, and the possibility that such assumptions may change during the completion of the Pre-feasibility Study; the timing, scope and results of the PFS Metallurgical Testing Programs and the Company’s plans for advancement of the North Island Project. Forward-looking statements necessarily involve known and unknown risks, including, without limitation, the Company’s ability to implement its business strategies; risks associated with mineral exploration and production; risks associated with general economic conditions; adverse industry events; stakeholder engagement; marketing and transportation costs; loss of markets; volatility of commodity prices; inability to access sufficient capital from internal and external sources, and/or inability to access sufficient capital on favourable terms; industry and government regulation; changes in legislation, income tax and regulatory matters; competition; currency and interest rate fluctuations; risks that the Technical Report is not filed within the timeline anticipated; risks that the results of the PFS Metallurgical Testing Programs differ from prior metallurgical test results and require changes to the Design Basis and the economic assumptions underlying the 2026 Resource Estimate; risks that the anticipated repurchase of a portion of the outstanding NSR royalty on the Red Dog and West Goodspeed deposits is not completed on the terms anticipated or at all; risks relating to permitting and regulatory approval timelines, including in respect of the BC Hydro System Impact Study and the Initial Project Description and other risks. Readers are cautioned that the foregoing list is not exhaustive.
Readers are further cautioned not to place undue reliance on forward-looking statements as there can be no assurance that the plans, intentions, or expectations upon which they are placed will occur. Such information, although considered reasonable by management at the time of preparation, may prove to be incorrect and actual results may differ materially from those anticipated. Forward-looking statements contained in this news release are expressly qualified by this cautionary statement.
The forward-looking statements contained in this news release represent the expectations of management of Northisle as of the date of this news release, and, accordingly, are subject to change after such date. Northisle does not undertake any obligation to update or revise any forward-looking statements, whether as a result of new information, future events or otherwise, except as expressly required by applicable securities law.
Neither the TSX Venture Exchange nor its Regulation Services Provider (as that term is defined in the policies of the TSX Venture Exchange) accepts responsibility for the adequacy or accuracy of this news release.
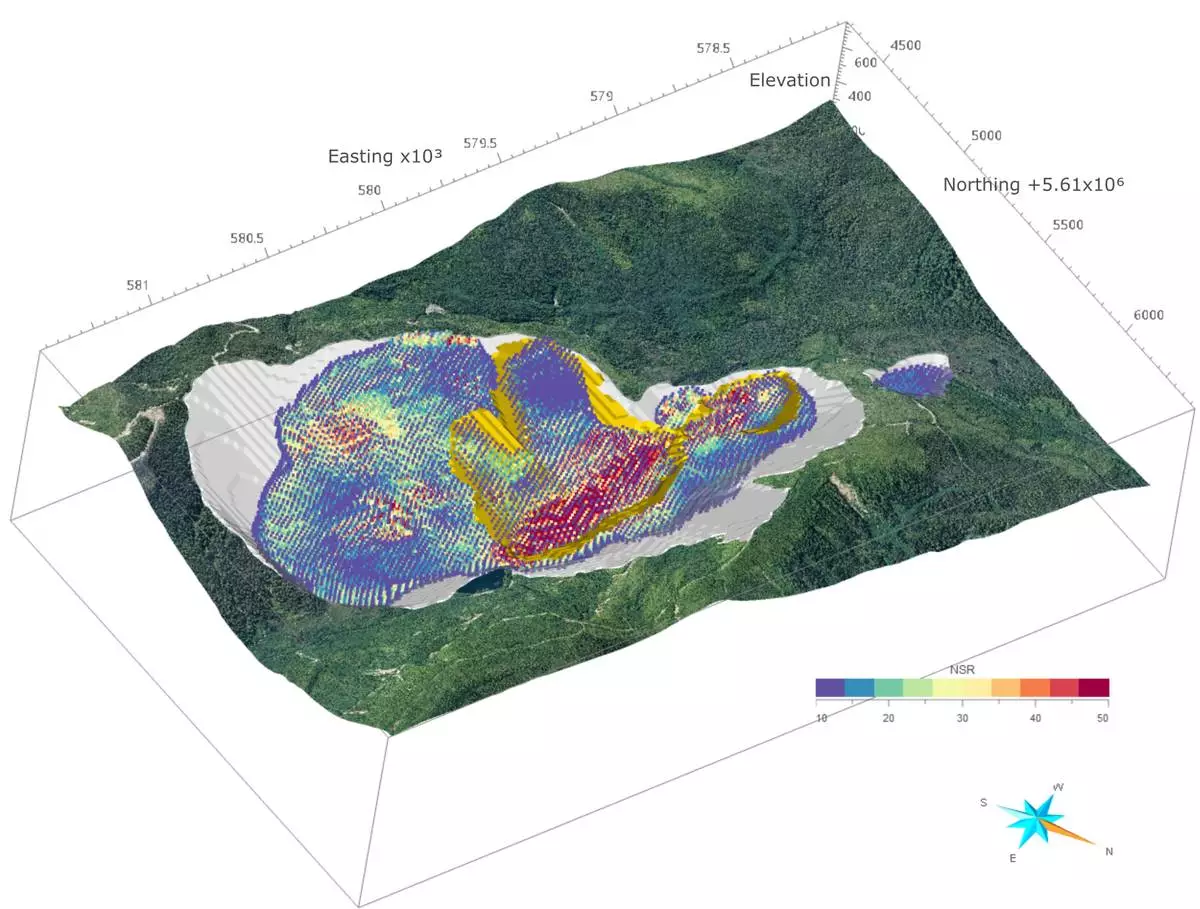
Figure 5: Hushamu Resource Shell and Block Model Showing NSR/tonne. Coordinates are reported in UTM Zone 9 North (NAD83 CRS, VD CVG28BC) with units in metres.
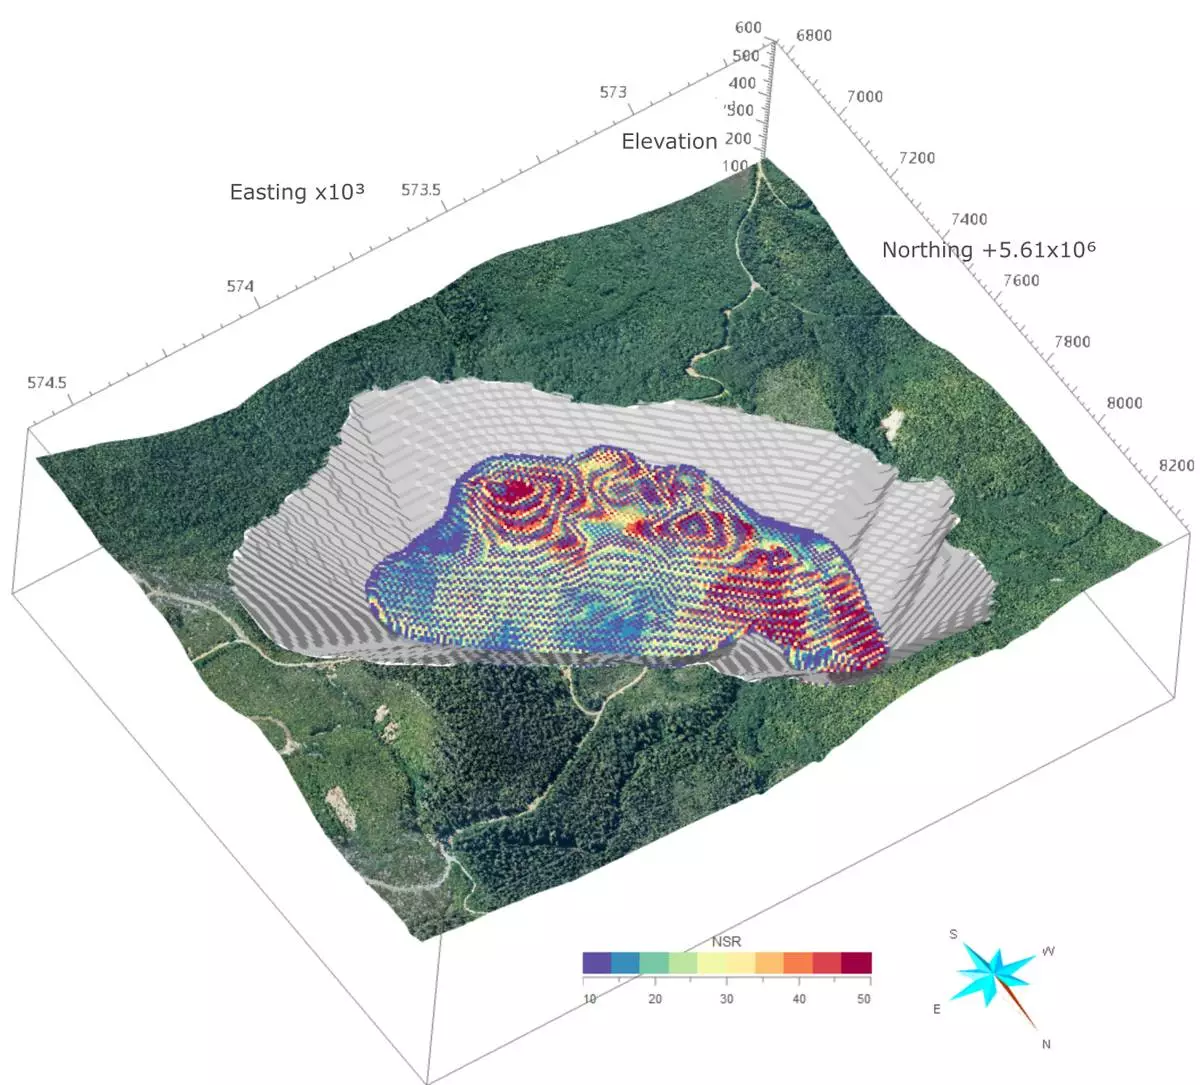
Figure 4: West Goodspeed Resource Shell and Block Model Showing NSR/tonne. Coordinates are reported in UTM Zone 9 North (NAD83 CRS, VD CVG28BC) with units in metres.
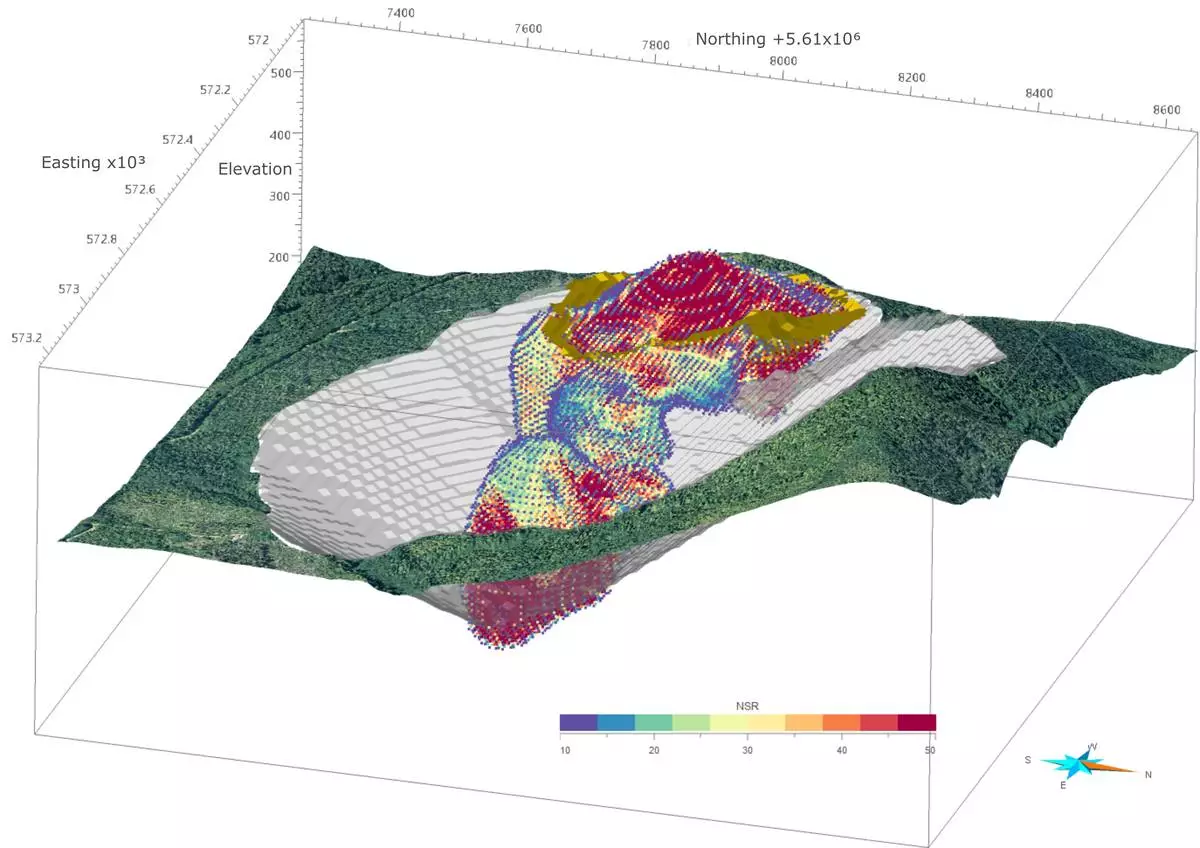
Figure 3: Red Dog Resource Shell and Block Model Showing NSR/tonne. Coordinates are reported in UTM Zone 9 North (NAD83 CRS, VD CVG28BC) with units in metres.
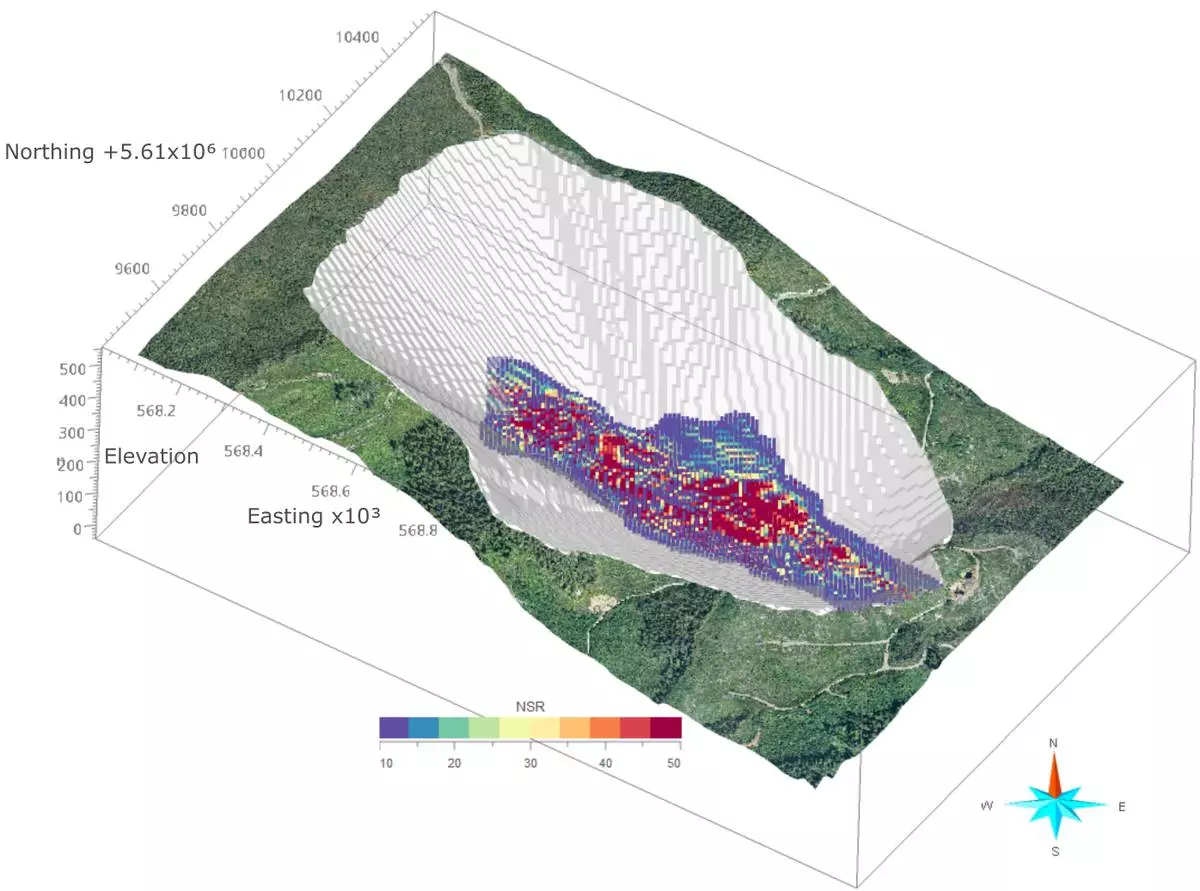
Figure 2: Northwest Expo Resource Shell and Block Model Showing NSR/tonne. Coordinates are reported in UTM Zone 9 North (NAD83 CRS, VD CVG28BC) with units in metres.
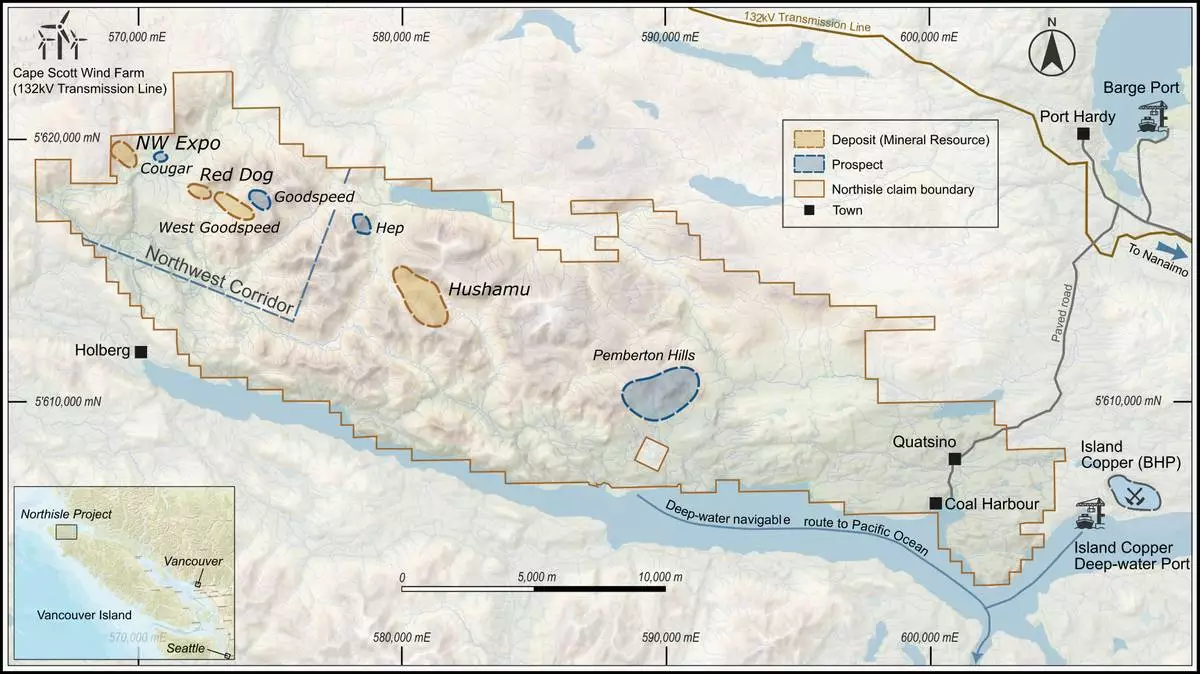
Figure 1: North Island Project Showing Location of Deposits and Prospects. Coordinates are reported in UTM Zone 9 North (NAD83 CRS, VD CVG28BC) with units in metres.