Construction output for second quarter of 2026
The total gross value of construction works (GVCW) performed by main contractors in the second quarter of 2026 increased by 4.1% in nominal terms over a year earlier to $72.4 billion, according to the provisional results of the Quarterly Survey of Construction Output released today (September 10) by the Census and Statistics Department (C&SD).
After discounting the effect of price changes, the provisional results showed that the total GVCW performed by main contractors increased by 2.2% in real terms over the same period. GVCW in real terms is derived by deflating the corresponding nominal value with an appropriate price index to the price level in the base period of 2000.
Analysed by type of construction works, the GVCW performed at private sector sites totalled $17.5 billion in the second quarter of 2026, up by 1.0% in nominal terms over a year earlier. In real terms, however, it slightly decreased by 0.8%. The GVCW performed at public sector sites increased by 6.2% in nominal terms over a year earlier to $33.6 billion in the second quarter of 2026. In real terms, it increased by 2.5%.
The GVCW performed by main contractors at locations other than construction sites amounted to $21.2 billion in the second quarter of 2026, up by 3.3% in nominal terms over a year earlier. In real terms, it increased by 4.8%. Construction works at locations other than construction sites included minor new construction activities and decoration, repair and maintenance for buildings; and electrical equipment installation and maintenance works at locations other than construction sites.
Analysed by major end-use group, the GVCW performed at construction sites in respect of residential buildings projects amounted to $22.3 billion in the second quarter of 2026, up by 7.0% in nominal terms over a year earlier. Over the same period, the GVCW performed at construction sites in respect of transport projects slightly increased by 0.3% in nominal terms to $8.3 billion in the second quarter of 2026.
On a seasonally adjusted quarter-to-quarter basis, the GVCW performed by main contractors remained virtually unchanged in nominal terms but slightly decreased by 0.7% in real terms in the second quarter of 2026 compared with the first quarter of 2026.
Table 1 shows the provisional figures on the GVCW performed by main contractors in the second quarter of 2026. Table 2 shows the revised figures for the first quarter of 2026.
Owing to the widespread sub-contracting practices in the construction industry, a construction company can be a main contractor for one contract and a sub-contractor for another contract at the same time. The GVCW performed by main contractors covers only those projects in which the construction company takes the role of a main contractor, but not projects in which it takes only the role of a sub-contractor. However, sub-contractors' contribution to projects should have been included in the GVCW performed by main contractors for whom they worked.
The classification in the construction sector follows the Hong Kong Standard Industrial Classification Version 2.0, which is used in various economic surveys for classifying economic units into different industry classes.
More detailed statistics are given in the "Report on the Quarterly Survey of Construction Output". Users can browse and download this publication at the website of the C&SD (www.censtatd.gov.hk/en/EIndexbySubject.html?pcode=B1090002&scode=330).
For enquiries about the survey results, please contact the Construction and Miscellaneous Services Statistics Section of the C&SD (Tel: 3903 6965; email: building@censtatd.gov.hk).
Source: AI-found images
Quarterly business receipts indices for service industries for second quarter of 2026
Business receipts in value terms of almost all major service industries showed increases of varying magnitudes in the second quarter of 2026 when compared with the second quarter of 2025, according to the provisional figures of business receipts indices released today (September 10) by the Census and Statistics Department (C&SD).
Comparing the second quarter of 2026 with the second quarter of 2025, double-digit increases were recorded in business receipts indices of the insurance (+60.7%), import/export trade (+37.7%), financing (except banking) (+29.1%), banking (+26.2%), transportation (+16.5%) and wholesale (+15.4%) industries. On the other hand, the warehousing and storage industry recorded a decrease of 4.1% in business receipts index during the same period.
Analysed by service domain, business receipts index of the computer and information technology services domain increased by 91.8% year-on-year during the same period, while that of the tourism, convention and exhibition services domain also increased by 3.9% year-on-year.
On a seasonally adjusted quarter-to-quarter comparison, business receipts in value terms of around half of the major service industries recorded increases of varying magnitudes in the second quarter of 2026 when compared with the first quarter of 2026. In particular, double-digit increases were recorded in business receipts indices of the financing (except banking) (+12.2%) and transportation (+10.7%) industries. On the other hand, business receipts index of the courier industry decreased by 7.8% during the same period.
Analysed by service domain, comparing the second quarter of 2026 with the first quarter of 2026 on a seasonally adjusted basis, business receipts index of the computer and information technology services domain increased by 7.5%, whereas that of the tourism, convention and exhibition services domain decreased by 6.5%.
Commentary
A Government spokesman said that business receipts of almost all service industries increased in the second quarter of 2026 over a year earlier. In particular, the insurance, import/export trade, financing (except banking), banking and wholesale industries continued to see double-digit growth in their business receipts, and that for the transportation industry also saw visible acceleration in growth. Meanwhile, business performance of the computer and information technology services domain remained robust with receipts continuing to grow, strongly underpinned by the global tech upcycle.
Looking ahead, businesses of service industries in general should see further growth amid the continued economic expansion. Nonetheless, external uncertainties and headwinds remain. The Government will continue to closely monitor the potential impacts of external developments on the services industries.
Further information
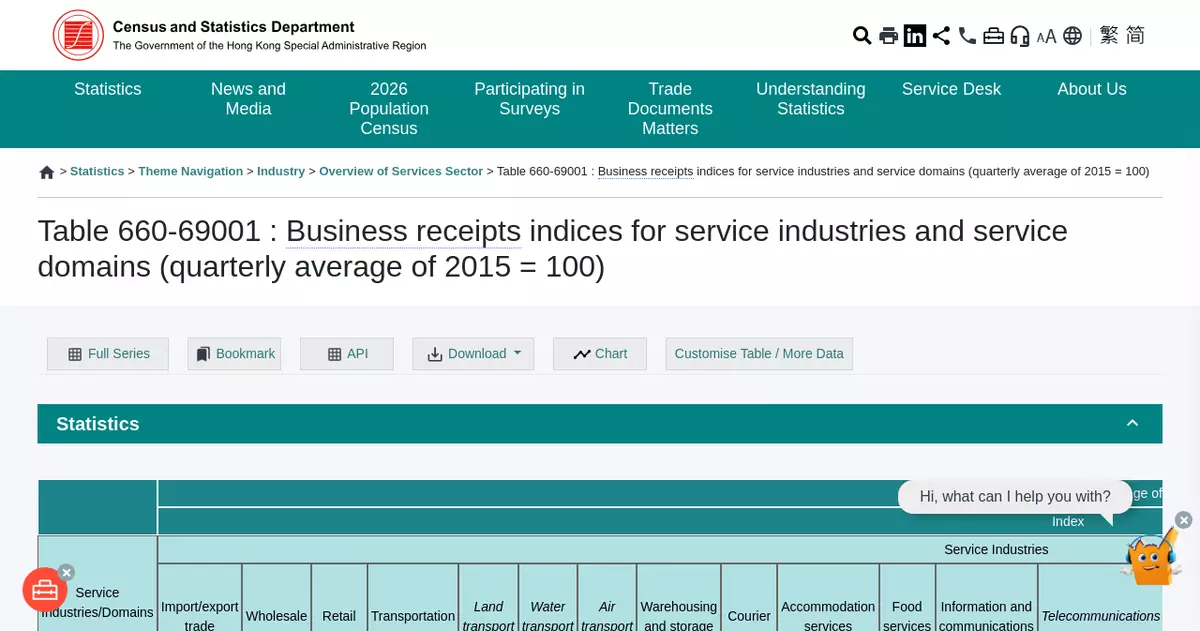
Table 1 presents the business receipts indices and their corresponding year-on-year rates of change in respect of selected service industries and service domains for the recent five quarters, while Table 2 shows the corresponding quarter-to-quarter rates of change in the business receipts indices for the recent five quarters based on the seasonally adjusted series.
The revised figures of business receipts indices for the second quarter of 2026 will be released at the website of the C&SD (www.censtatd.gov.hk/en/web_table.html?id=660-69001) on October 20, 2026.
Data for compiling the business receipts indices are mainly based on the Quarterly Survey of Service Industries conducted by the C&SD, supplemented by relevant data provided by the Hong Kong Monetary Authority and the Hong Kong Tourism Board.
A service domain differs from a service industry in that it comprises those economic activities which straddle different industries but are somehow related to a common theme. It may include all activities carried out by all companies in a service industry that is closely related to the domain. For a service industry that is less closely related, however, only a portion of the companies in the industry or even only part of the economic activities of the companies is related to the domain. Taking the tourism, convention and exhibition services domain as an example, it includes all services of convention and exhibition organisers, short-term accommodation services and services of travel agents, and some of the services (only those involving visitors as customers) of restaurants, retailers and transport operators.
The classification of service industries follows the Hong Kong Standard Industrial Classification Version 2.0, which is used in various economic surveys for classifying economic units into relevant industry classes.
More detailed statistics are given in the report "Quarterly Business Receipts Indices for Service Industries, Second Quarter 2026". Users can browse and download this publication at the website of the C&SD (www.censtatd.gov.hk/en/EIndexbySubject.html?pcode=B1080006&scode=520).
For enquiries about the business receipts indices, please contact the Business Services Statistics Section of the C&SD (Tel: 3903 7274 or e-mail: business-receipts@censtatd.gov.hk).
Source: AI-found images