
Unemployment and underemployment statistics for June - August 2026
According to the latest labour force statistics (i.e. provisional figures for June - August 2026) released today (September 17) by the Census and Statistics Department (C&SD), the seasonally adjusted unemployment rate increased from 3.7% in May - July 2026 to 3.8% in June - August 2026. The underemployment rate also increased from 1.7% in May - July 2026 to 1.9% in June - August 2026.
Click to Gallery
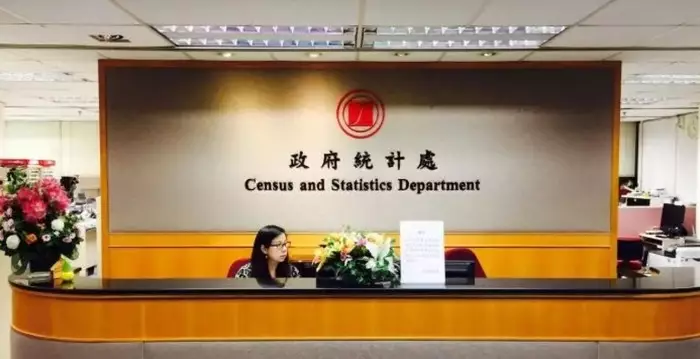
The Census and Statistics Department, Photo source: reference image
Photo source: reference image

The Secretary for Labour and Welfare, Mr Chris Sun, Photo source: reference image
Photo source: reference image
The Census and Statistics Department, Photo source: reference image
Comparing June - August 2026 with May - July 2026, the unemployment rate (not seasonally adjusted) increased across most major economic sectors, with more distinct increase observed in the food and beverage service activities sector. As to the underemployment rate, increases were mainly seen in the food and beverage service activities sector and construction sector.
Total employment increased by around 4 400 from 3 647 600 in May - July 2026 to 3 652 000 in June - August 2026. Over the same period, the labour force also increased by around 12 600 from 3 793 300 to 3 805 900.
The number of unemployed persons (not seasonally adjusted) increased by around 8 200 from 145 700 in May - July 2026 to 153 900 in June - August 2026. Over the same period, the number of underemployed persons also increased by around 5 900 from 66 200 to 72 100.
Photo source: reference image
Commentary
Commenting on the latest unemployment figures, the Secretary for Labour and Welfare, Mr Chris Sun, said, "The seasonally adjusted unemployment rate edged up by 0.1 percentage point over the preceding three-month period to 3.8% in June - August 2026. The underemployment rate also rose by 0.2 percentage point to 1.9%. Over the same period, both the labour force and total employment increased further."
The Secretary for Labour and Welfare, Mr Chris Sun, Photo source: reference image
Looking ahead, Mr Sun said, "The continued expansion of the local economy is expected to underpin overall labour market conditions, though employment situations across various industries will continue to hinge on their respective business conditions. Meanwhile, the potential impacts of evolving external uncertainties on corporate hiring sentiments still warrant attention."
Photo source: reference image
Further information
The unemployment and underemployment statistics were compiled from the findings of the continuous General Household Survey.
In the survey, the definitions used in measuring unemployment and underemployment follow closely those recommended by the International Labour Organization. The employed population covers all employers, self-employed persons, employees (including full-time, part-time, casual workers, etc.) and unpaid family workers. Unemployed persons by industry (or occupation) are classified according to their previous industry (or occupation).
The survey for June - August 2026 covered a sample of some 25 000 households or 65 000 persons, selected in accordance with a scientifically designed sampling scheme to represent the population of Hong Kong. Labour force statistics compiled from this sample represented the situation in the moving three-month period of June to August 2026.
Data on labour force characteristics were obtained from the survey by interviewing each member aged 15 or over in the sampled households.
Statistical tables on the latest labour force statistics can be downloaded at the website of the C&SD (www.censtatd.gov.hk/en/scode200.html). More detailed analysis of the labour force characteristics is given in the "Quarterly Report on General Household Survey" which is published four times a year. The latest issue of the report contains statistics for the quarter April - June 2026 while the next issue covering the quarter July - September 2026 will be available by end November 2026. Users can also browse and download this publication at the website of the C&SD (www.censtatd.gov.hk/en/EIndexbySubject.html?pcode=B1050001&scode=200).
For enquiries about labour force statistics, please contact the General Household Survey Section (3) of the C&SD (Tel: 2887 5508 or email: ghs@censtatd.gov.hk).