WASHINGTON (AP) — The U.S. economy grew at a solid 2.2% pace from April through June as consumer spending and business investment came in strong.
Growth in gross domestic product — the nation’s output of a goods and services — decelerated from a 2.5% pace from January through March, the Commerce Department reported Wednesday. The second-quarter growth was an improvement on the department’s previous estimate of 1.5% — a surprise to economists who had expected little or no change in the GDP number.
Consumer spending — which accounts for about 70% of U.S. economic activity — increased at a healthy 3.8% annual pace, up from 0.7% in the January-March period. Spending has been helped by a strong stock market, which reflects enthusiasm over the prospects for artificial intelligence and which enriches wealthy investors and gives them more money to buy things with.
The overall growth number was dragged down by imports. They are subtracted from growth because GDP is only supposed to count domestic production. Imports rose at a 12.6% annual pace from April through June, partly due to a surge in shipments of computer chips and other products that support artificial intelligence investment, and slashed nearly 1.7 percentage points off second-quarter growth.
The U.S. economy has proven surprisingly resilient in the face of fighting with Iran and the energy price spike it caused.
Business investment, excluding housing, rose at a 9% clip in the second quarter, reflecting the AI investment boom. And a measure of the economy’s underlying strength — which strips out volatile government spending and trade numbers — grew at a strong 4.6% rate, up from 1.8% in the first quarter.
“The economy is increasingly reliant on AI gains and the corresponding wealth effects boosting higher-income households’ spending power to fuel recent growth,” said Michael Pearce, chief U.S. economist at Oxford Economics. "The economy remains sensitive to a sudden reversal of optimism on AI.''
Investment in housing rose 2.8% ticking up for the first time since the end of 2024. The housing market has been depressed by high mortgage rates.
Wednesday’s report was the last of three Commerce Department estimates of second-quarter GDP growth. The first look at third-quarter growth is due Oct. 29.

FILE - A Coherent manufacturing facility in Sherman, Texas, Tuesday, June 16, 2026. (AP Photo/Jeffrey McWhorter, File)
NEW YORK--(BUSINESS WIRE)--Sep 30, 2026--
OptionMetrics, the leading historical options data and analytics provider for institutional investors and academic researchers worldwide, today announced IvyDB TradeFlow to give quantitative professionals, options traders, and academic researchers an edge with data and analytics to classify retail versus institutional options trading and liquidity in today’s fast-moving markets.
This press release features multimedia. View the full release here: https://www.businesswire.com/news/home/20260930904765/en/
IvyDB TradeFlow is an evolution of OptionMetrics IvyDB Signed Volume and leverages a proprietary algorithm that delivers enhanced signaling and unmatched insights into order flow, participant activity, buy/sell pressure, and other critical analytics. It rapidly orders, classifies, and categorizes trade data from all U.S. exchanges, and sequentially processes data and analytics on retail and institutional investor trading at 5- and 30-minute, as well as end of day, intervals.
Designed to work alongside the gold standard in options data and analytics, IvyDB US, IvyDB TradeFlow tracks volume, buying and selling pressure, lot sizes, whether a trade occurred at the bid, ask, or midpoint for every option, every day since January 2016. It incorporates trade description codes and exchange venue data alongside Volume-Weighted Average Price (VWAP, or the average price a stock has traded at throughout the day) to more precisely assign directional volume and resolve midpoint trades. IvyDB TradeFlow also offers measures of trade aggressiveness relative to the SEC’s National Best Bid and Offer (NBBO) and proprietary indicators that identify and distinguish retail from institutional order flow.
“With the growing size and speed of today’s options market, and participation from retail investors, options activity can influence underlying stock prices, realized returns, and volatility. To evaluate strategies, Institutions need to understand how much is trading, who is driving activity and how aggressively they are positioning,” said Eran Steinberg, COO at OptionMetrics. “IvyDB TradeFlow offers a comprehensive view of trading across retail investors and market makers to identify shifts in positioning, liquidity and sentiment in rapidly changing markets.”
Contact OptionMetricsto learn more.
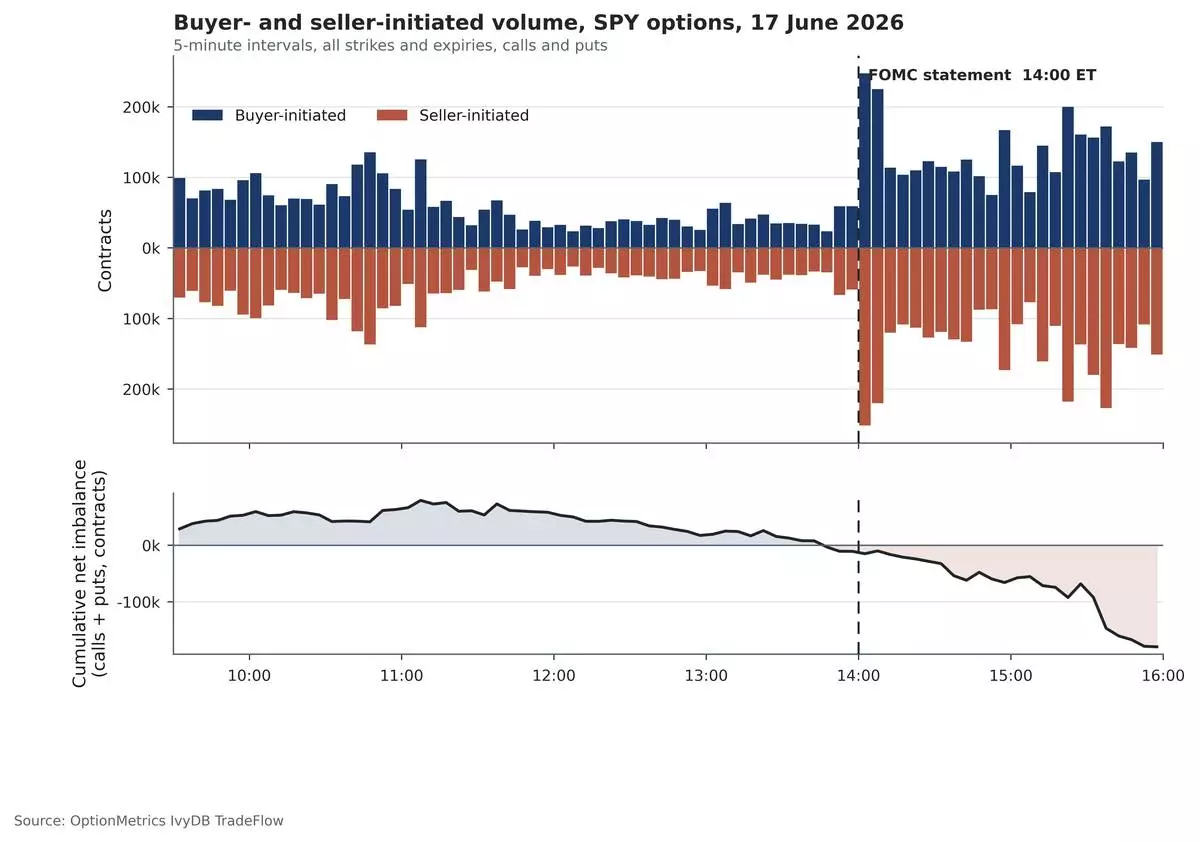
This chart illustrates total buyer- and seller-initiated trades of SPY options in 5-minute intervals on FOMC announcement day, with net imbalance defined as buyer-initiated minus seller-initiated volume. The chart indicates that heading into the 2:00pm ET release, the market broadly expected the Fed to hold its target rate. With the binary event resolved and no dovish shock to reprice, net options imbalance turned negative immediately after 2:00pm as traders sold contracts and unwound pre-announcement positions, representing post-event de-risking and volatility unwind. The chart was created with OptionMetrics’ IvyDB TradeFlow, which provides data and analytics on retail and institutional options trading and liquidity.