IRVINE, Calif.--(BUSINESS WIRE)--Apr 7, 2026--
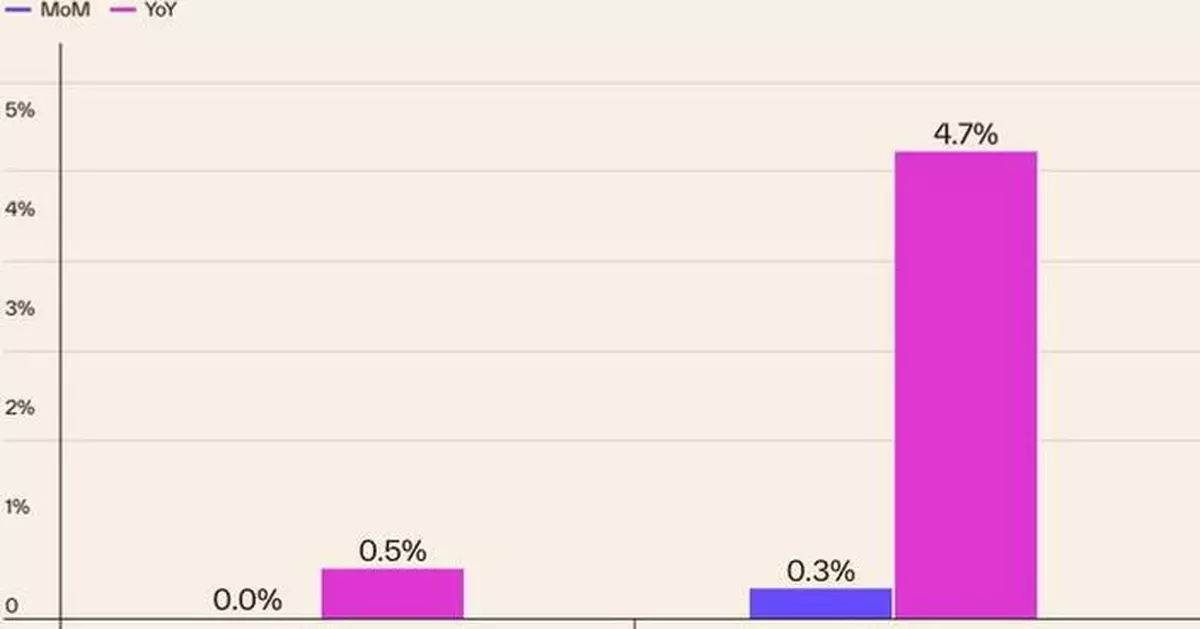
Cotality™, a leader in property information, analytics, and data‑enabled solutions, today released its Home Price Index™ with February 2026 data. Year-over-year home price growth slowed to 0.5% in February as the U.S. housing market continues to rebalance.
This press release features multimedia. View the full release here: https://www.businesswire.com/news/home/20260407344210/en/
The current market is divided, both nationally and within specific regions. The Midwest and Northeast, led by states like New Jersey (+5.93%) and Illinois (+4.83%), are showing stability, supported by relative affordability and employment in higher wage sectors, including biotech and medical research in Massachusetts and Pennsylvania, financial services and fintech in New York and New Jersey, and green infrastructure in other coastal states. In the Midwest, home price stability is supported by a resurgence of manufacturing as companies mitigate tariffs, CHIPS Act investments in states like Ohio and Michigan, and renewable energy growth in states like Iowa and Kansas. These states are also attracting businesses that are leaving the higher-cost coastal metros.
Meanwhile, slowing price growth continues in Washington, D.C. (-3.01%), Florida (-2.30%), and Montana (-1.52%), the three locations with the largest negative year-over-year changes.
“These diverse trends indicate an ongoing process of price discovery—one where sales and comparisons remain limited—and underscore a market that is rebalancing locally rather than correcting nationally,” said Cotality Chief Economist Dr. Selma Hepp. “Although the steady decrease in mortgage rates prior to the spring homebuying season raised hopes for a rebound in home prices and sales in 2026, the recent surge in rates has reduced demand in the housing market, shifting expectations for a broader recovery this year.”
Top Takeaways:
The next Cotality Home Price Index will be released on May 5, 2026, featuring data for March 2026. For ongoing housing trends and data, visit the Cotality Insights blog: www.cotality.com/insights.
Methodology
The Cotality HPI™ is built on industry-leading public record, servicing, and securities real-estate databases and incorporates more than 45 years of repeat-sales transactions for analyzing home price trends. Generally released on the first Tuesday of each month with an average five-week lag, the Cotality HPI is designed to provide an early indication of home price trends by market segment and for the Single-Family Combined tier, representing the most comprehensive set of properties, including all sales for single-family attached and single-family detached properties. The indices are fully revised with each release and employ techniques to signal turning points sooner. The Cotality HPI provides measures for multiple market segments, referred to as tiers, based on property type, price, time between sales, loan type (conforming vs. non-conforming) and distressed sales. Broad national coverage is available from the national level down to ZIP Code, including non-disclosure states.
Cotality HPI Forecasts™ are based on a two-stage, error-correction econometric model that combines the equilibrium home price—as a function of real disposable income per capita—with short-run fluctuations caused by market momentum, mean-reversion, and exogenous economic shocks like changes in the unemployment rate. With a 30-year forecast horizon, Cotality HPI Forecasts project Cotality HPI levels for two tiers — Single-Family Combined (both attached and detached) and Single-Family Combined Excluding Distressed Sales. As a companion to the Cotality HPI Forecasts, Stress-Testing Scenarios align with Comprehensive Capital Analysis and Review (CCAR) national scenarios to project five years of home prices under baseline, adverse and severely adverse scenarios at state, metropolitan areas and ZIP Code levels. The forecast accuracy represents a 95% statistical confidence interval with a +/- 2% margin of error for the index.
About Market Risk Indicators
Market Risk Indicators are a subscription-based analytics solution that provide monthly updates on the overall health of housing markets across the country. Cotality data scientists combine world-class analytics with detailed economic and housing data to help determine the likelihood of a housing bubble burst in 392 major metros and all 50 states. Market Risk Indicators is a multi-phase regression model that provides a probability score (from 1 to 100) on the likelihood of two scenarios per metro: a >10% price reduction and a ≤ 10% price reduction. The higher the score, the higher the risk of a price reduction.
About the Market Condition Indicators
As part of the Cotality HPI and HPI Forecasts offerings, Market Condition Indicators are available for all metropolitan areas and identify individual markets as overvalued, at value or undervalued. These indicators are derived from the long-term fundamental values, which are a function of real disposable income per capita. Markets are labeled as overvalued if the current home price indexes exceed their long-term values by greater than 10% and undervalued where the long-term values exceed the index levels by greater than 10%.
Source: Cotality
The data provided are for use only by the primary recipient or the primary recipient's publication or broadcast. This data may not be resold, republished or licensed to any other source, including publications and sources owned by the primary recipient's parent company without prior written permission from Cotality. Any Cotality data used for publication or broadcast, in whole or in part, must be sourced as coming from Cotality, a data and analytics company. For use with broadcast or web content, the citation must directly accompany first reference of the data. If the data are illustrated with maps, charts, graphs, or other visual elements, the Cotality logo must be included on screen or website. For questions, analysis or interpretation of the data, contact Charity Head at newsmedia@Cotality.com. Data provided may not be modified without the prior written permission of Cotality. Do not use the data in any unlawful manner. The data are compiled from public records, contributory databases and proprietary analytics, and its accuracy is dependent upon these sources.
About Cotality
Cotality accelerates data, insights, and workflows across the property ecosystem to enable industry professionals to surpass their ambitions and impact society. With billions of real-time data signals across the life cycle of a property, we unearth hidden risks and transformative opportunities for agents, lenders, carriers, and innovators. Get to know us at www.cotality.com.
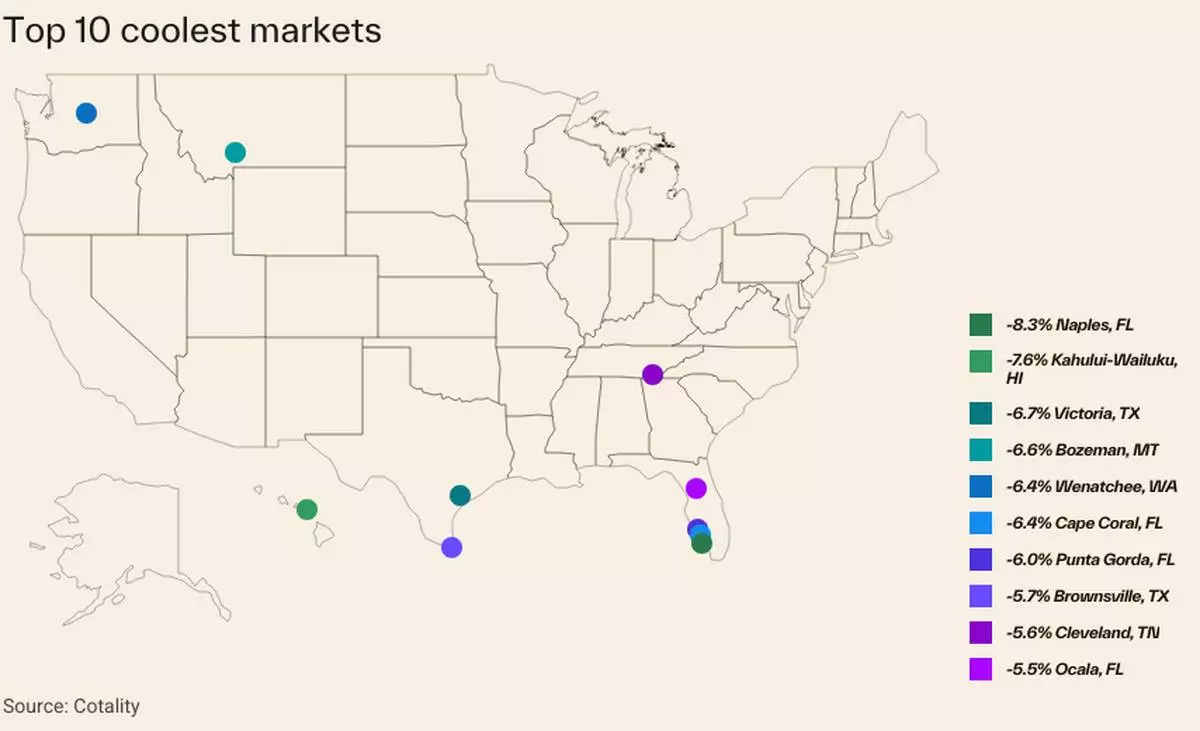
The coolest U.S. housing markets in February 2026 according to Cotality's Home Price Index.
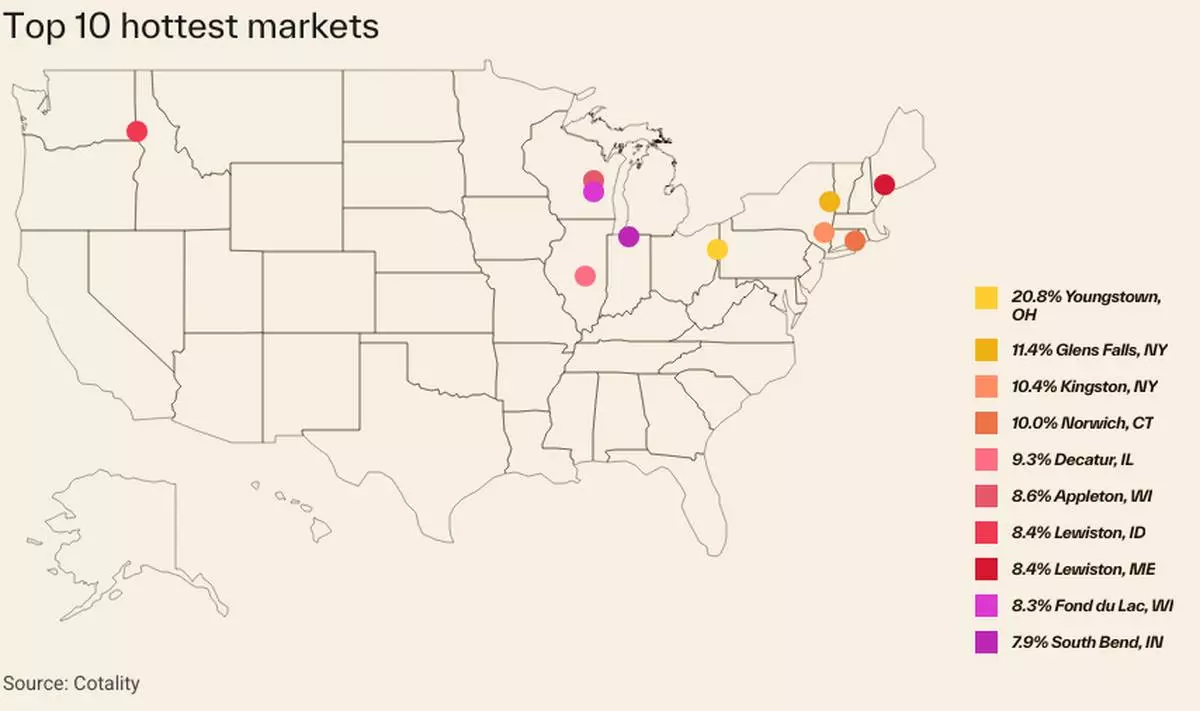
The hottest U.S. housing markets in February 2026 according to Cotality's Home Price Index.
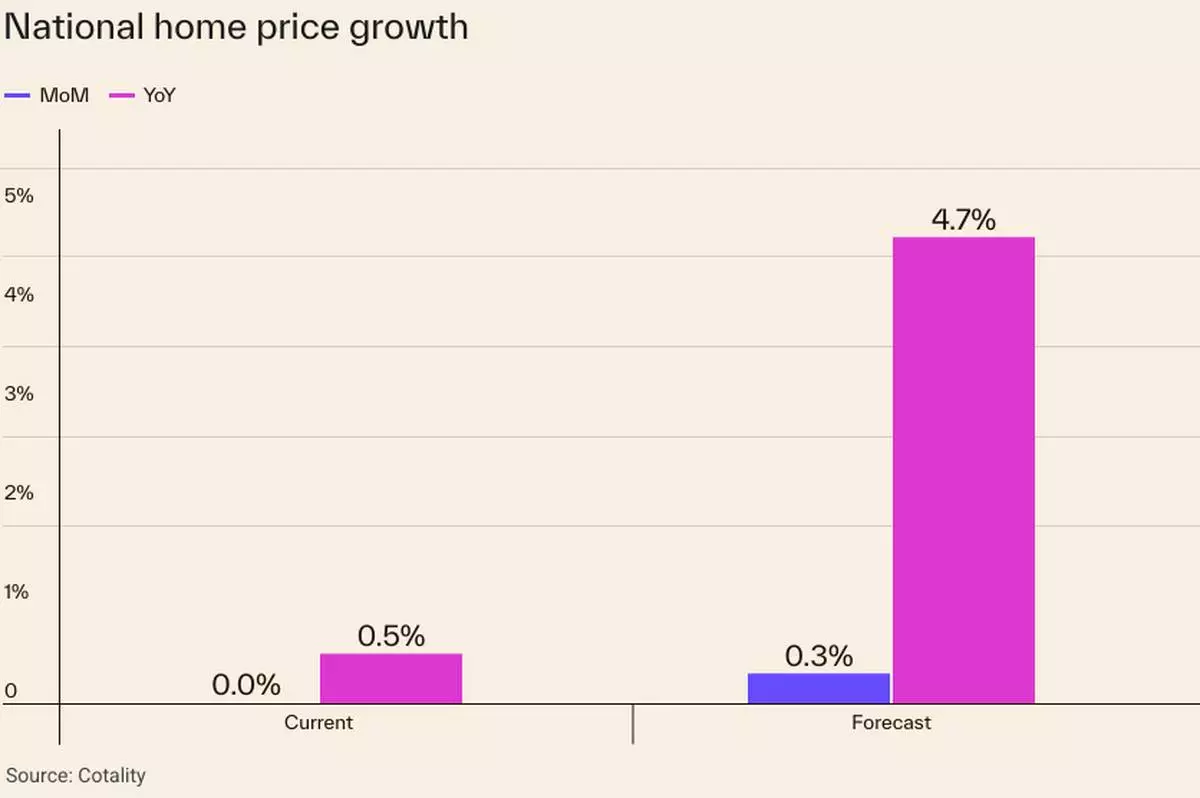
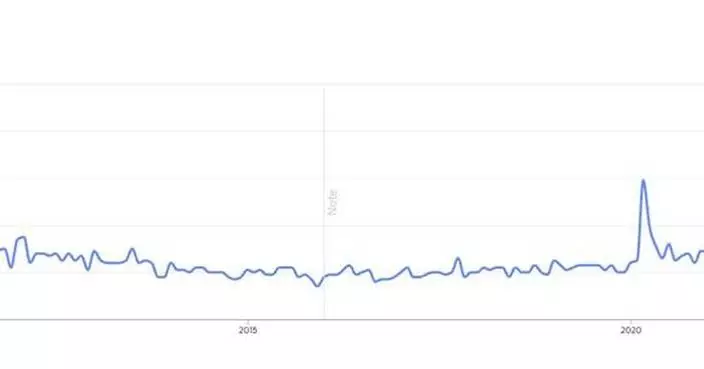
Cotality's National Home Price Index for February 2026 and the forecasted year-over-year growth in 2027.