
Skip to Content Facebook Feature Image

PRIMERICA HOUSEHOLD BUDGET INDEX™ (HBI™): Rising Gas Prices Limit Purchasing Power of Middle-Income Americans in April

Business

PRIMERICA HOUSEHOLD BUDGET INDEX™ (HBI™): Rising Gas Prices Limit Purchasing Power of Middle-Income Americans in April
Business

Business

PRIMERICA HOUSEHOLD BUDGET INDEX™ (HBI™): Rising Gas Prices Limit Purchasing Power of Middle-Income Americans in April

2026-05-28 12:02 Last Updated At:12:11

DULUTH, Ga.--(BUSINESS WIRE)--May 28, 2026--

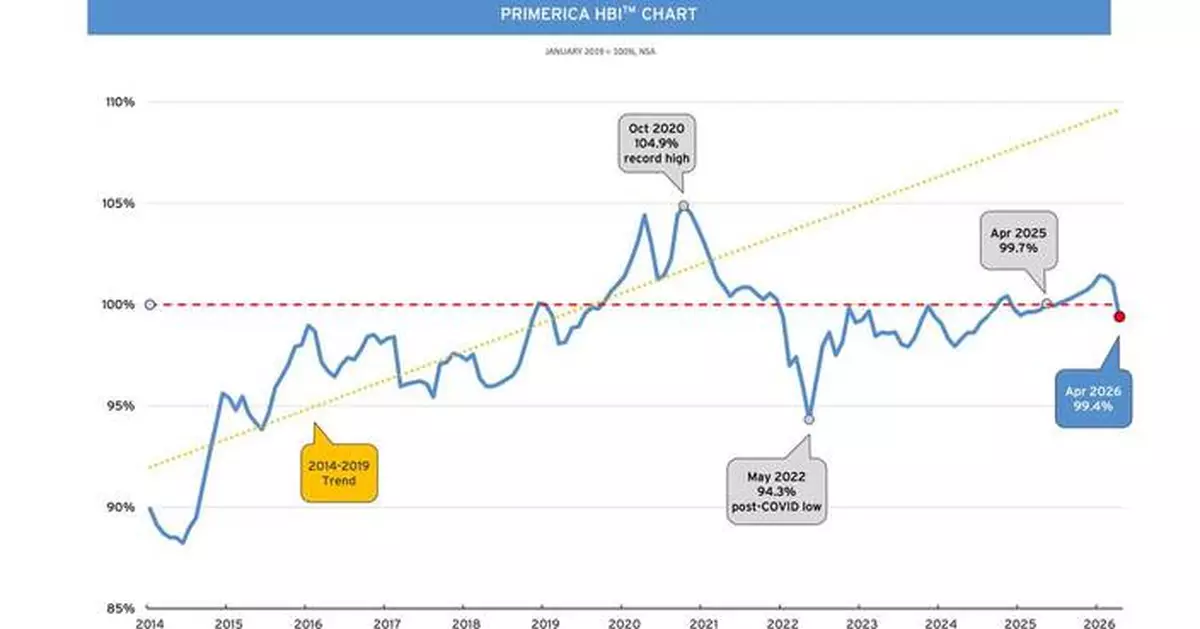
The latest Primerica Household Budget Index™ (HBI™) data, a monthly economic metric that examines how inflation and wage trends impact the ability of middle-income families to afford life’s everyday necessities, is estimated at 99.4% in April, down 1.7% from March and 0.3% from a year ago.

This press release features multimedia. View the full release here: https://www.businesswire.com/news/home/20260527431413/en/

The decline is driven mainly by increasing gas prices, which rose 11% in the past month and 28% year-over-year.

The Consumer Price Index (CPI), which measures inflation for a comprehensive basket of goods for all U.S. households, increased 3.8% in April compared to a year ago. Adjusting the CPI to narrow the impact of inflation to focus specifically on middle-income families and their purchase patterns, inflation rose to 4.4% in April 2026 compared to April 2025. The cost of necessity items as used in the HBI™ metric (food, utilities, gas, auto insurance, and health care) for middle-income Americans is up 5.5% from a year ago.

About the Primerica Household Budget Index™ (HBI™) Data

The Primerica Household Budget Index™ (HBI™) data is constructed monthly on behalf of Primerica by its chief economic consultant Amy Crews Cutts, PhD, CBE ®. The index measures the purchasing power of middle-income families with household incomes from $30,000 to $130,000 and is developed using data from the U.S. Bureau of Labor Statistics, the U.S. Bureau of Census, and the Federal Reserve Bank of Kansas City. The index looks at the cost of necessities including food, gas, auto insurance, utilities, and health care and earned income to track differences in inflation and wage growth.

Primerica’s HBI™ metric was created to fill an information void around the economy’s impact on middle-income families. Metrics like the Consumer Price Index (CPI) measure overall inflation but don’t offer a clear picture of how it impacts middle-income Americans. Middle-income households play a key role in driving consumer spending and the overall economy as they account for over 55% of the U.S. population. The purchasing power of middle-income families are a key barometer of real-time economic trends. Understanding middle-income households’ purchasing power is important because it shows whether they are gaining financial ground or falling behind.

The HBI™ data uses January 2019 as its baseline, with the value set to 100% at that point in time.

Periodically, prior HBI™ values may be modified due to revisions in the CPI series and Consumer Expenditure Survey releases by the U.S. Bureau of Labor Statistics (BLS). Beginning with the December 2024 release of the index, the expenditure weights have been updated to the most recent (Q1 2024) data and auto insurance has been added to the group of necessity items. For more information, visit householdbudgetindex.com.

About Primerica, Inc.

Primerica, Inc. is a leading diversified financial services distribution company serving middle-income households in the United States and Canada. Our licensed representatives educate families on how to prepare for a more secure financial future and help them achieve their financial goals with our term life insurance and third-party mutual funds, managed accounts, annuities, loans and other financial products. We insured over 5.5 million lives and had approximately 3.1 million client investment accounts as of December 31, 2025. Through our life insurance subsidiaries in North America, in 2025 Primerica was the #3 issuer of term life insurance, which we largely reinsure. Primerica stock is included in the S&P MidCap 400 and the Russell 1000 stock indices and is traded on The New York Stock Exchange under the symbol “PRI”. We are headquartered in Duluth, Georgia.
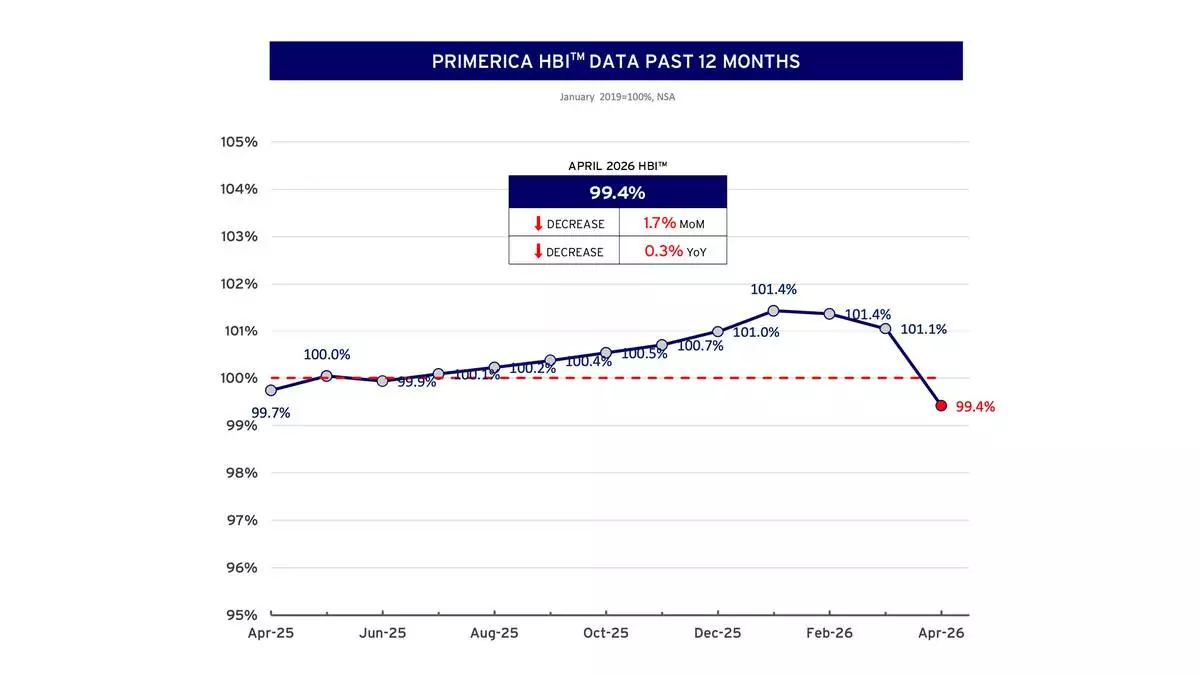
The latest Primerica Household Budget Index™ (HBI™) data, a monthly economic metric that examines how inflation and wage trends impact the ability of middle-income families to afford life’s everyday necessities, is estimated at 99.4% in April, down 1.7% from March and 0.3% from a year ago. The decline is driven mainly by increasing gas prices, which rose 11% in the past month and 28% year-over-year.
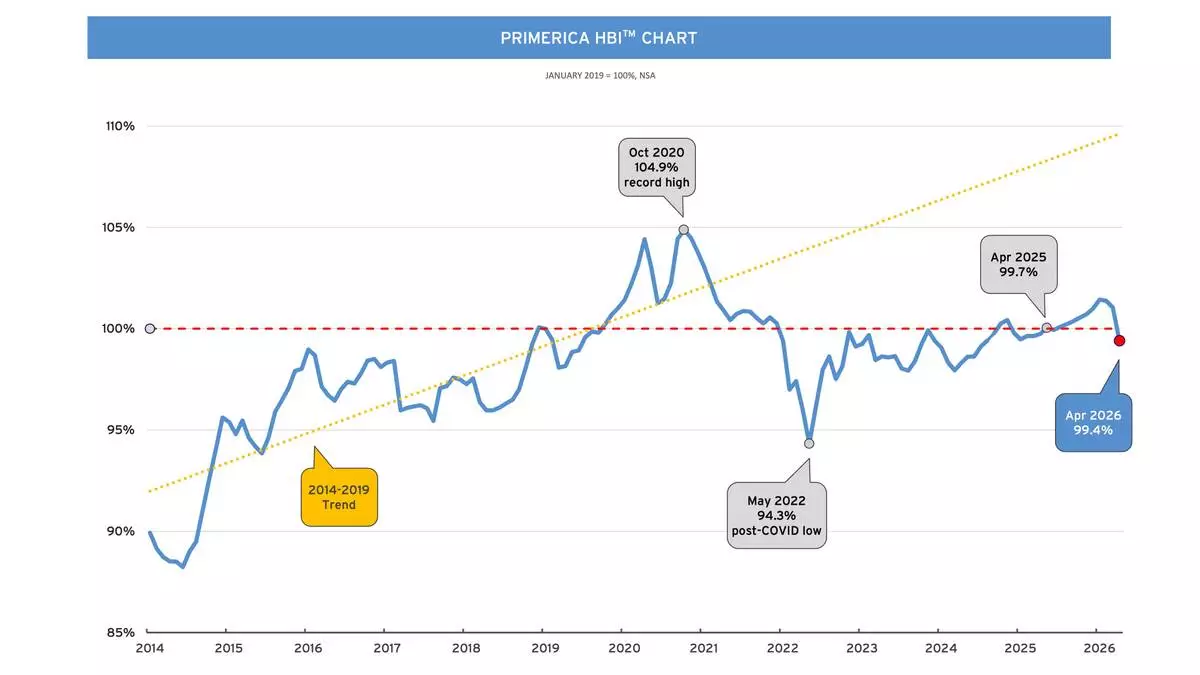
The latest Primerica Household Budget Index™ (HBI™) data, a monthly economic metric that examines how inflation and wage trends impact the ability of middle-income families to afford life’s everyday necessities, is estimated at 99.4% in April, down 1.7% from March and 0.3% from a year ago. The decline is driven mainly by increasing gas prices, which rose 11% in the past month and 28% year-over-year.

The latest Primerica Household Budget Index™ (HBI™) data, a monthly economic metric that examines how inflation and wage trends impact the ability of middle-income families to afford life’s everyday necessities, is estimated at 99.4% in April, down 1.7% from March and 0.3% from a year ago. The decline is driven mainly by increasing gas prices, which rose 11% in the past month and 28% year-over-year.

The latest Primerica Household Budget Index™ (HBI™) data, a monthly economic metric that examines how inflation and wage trends impact the ability of middle-income families to afford life’s everyday necessities, is estimated at 99.4% in April, down 1.7% from March and 0.3% from a year ago. The decline is driven mainly by increasing gas prices, which rose 11% in the past month and 28% year-over-year.

NEW YORK (AP) — The proportion of Americans without health insurance held steady at around 8% of the population in 2025, according to new findings from the U.S. Centers for Disease Control and Prevention.

The national survey results, released Thursday, show the all-ages uninsured rate has stayed significantly down from where it was several years ago, but the ranks of the uninsured could soon expand as the Trump administration’s sweeping changes to the health landscape begin to take hold.

Massive changes to Medicaid, the government’s safety-net health program for low-income Americans, passed into law last year could result in 10 million more uninsured individuals over a decade, according to Congressional Budget Office estimates.

And the expiration this year of certain Affordable Care Act subsidies — which had offset premium costs — is also contributing to reduced participation in marketplace health programs. Around 5 million fewer people are expected to enroll in those plans in 2026 compared with 2025, according to the healthcare research nonprofit KFF.

The government has multiple programs for tracking Americans’ insurance status, which can give different numbers depending on factors like timing and question wording. Many researchers consider the U.S. Census Bureau to be “the official scorekeeper,” said David Howard, an Emory University health policy and management professor.

But the CDC survey results tracks closely with that, and they offer the first complete data for all of 2025 — the first year of President Donald Trump’s second term in office.

The Trump administration has sought to expand access to low-premium catastrophic health insurance plans and lower drug prices for Americans who don’t have health insurance. It has also suggested that projected insurance enrollment declines indicate a drop-off of fraudulent and ineligible enrollees, rather than eligible Americans.

Although the share of insured and uninsured stayed roughly the same in 2025 as the year before, the number of uninsured grew by about 800,000 — 300,000 of them children. The growth of the overall U.S. population helps explain that.

The survey results also suggest a possible increased insured rate among Hispanic Americans. But that may in part reflect the effects of the Trump administration’s immigration crackdown, if uninsured members of that group left the country, Howard said.

Most Americans 65 and older have health insurance through the federal Medicare program. It's different for younger Americans, many of whom are covered through a patchwork of public and private insurance programs.

The percentage of Americans under 65 who were uninsured rose in the 1980s, 1990s and early 2000s — from 12% in 1980 to more than 18% in 2010. It fell following passage of the Affordable Care Act in 2010, which expanded Medicaid programs and enacted measures to make affordable health insurance available to more people.

By 2016 it dropped nearly to 10%, before rising to 11 to 12% during Trump’s first administration, according to historical survey data from the CDC's National Center for Health Statistics.

The COVID-19 pandemic saw the rate of uninsured fall again, as a result of government policies put in place to preserve coverage as people faced disruptions related to the pandemic. The rate hit an all-time low in 2023, falling below 9%.

The Associated Press Health and Science Department receives support from the Howard Hughes Medical Institute’s Department of Science Education and the Robert Wood Johnson Foundation. The AP is solely responsible for all content.

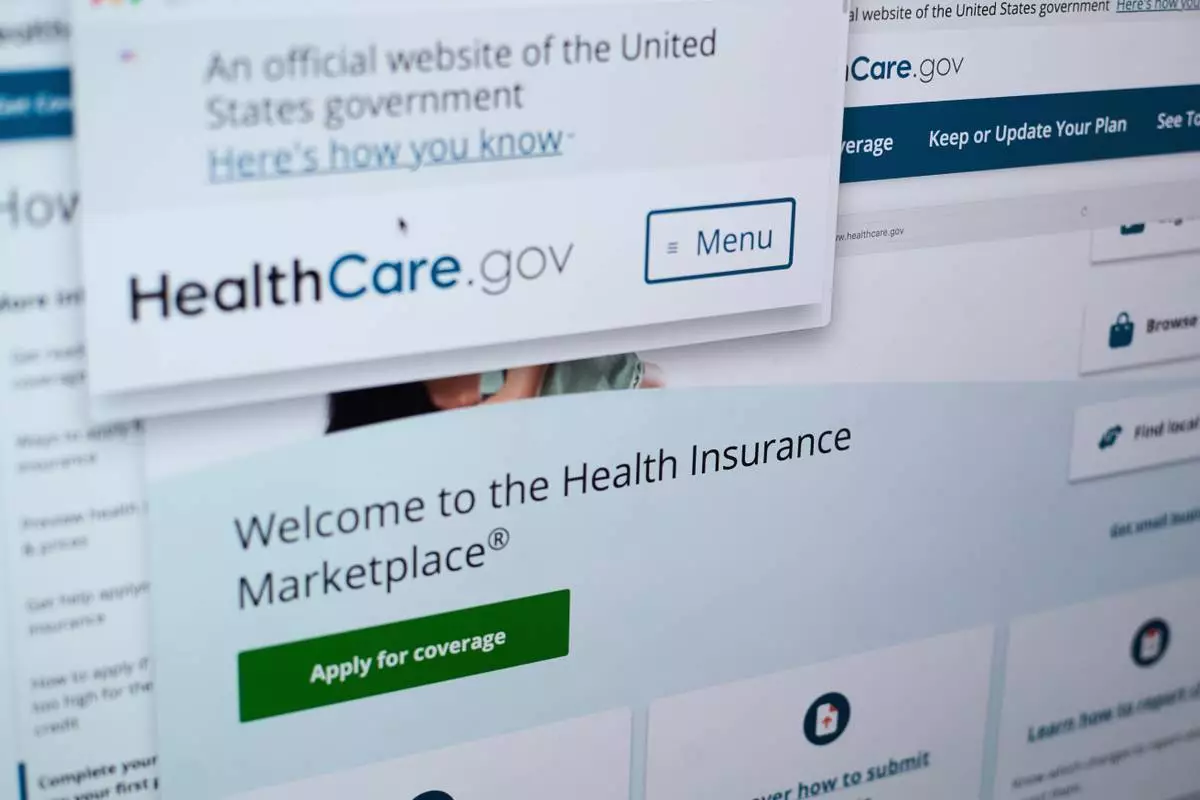
FILE - Pages from the U.S. Affordable Care Act health insurance website, healthcare.gov, are displayed on a computer screen in New York, Aug. 19, 2025. (AP Photo/Patrick Sison, File)

FILE - Pages from the U.S. Affordable Care Act health insurance website, healthcare.gov, are displayed on a computer screen in New York, Aug. 19, 2025. (AP Photo/Patrick Sison, File)

Recommended Articles