

DENVER--(BUSINESS WIRE)--Oct 13, 2026--
SSR Mining Inc. (Nasdaq/TSX: SSRM) (“SSR Mining”, the “Company”, “we”, “us”, or “our”) announces the results of a Technical Report Summary (“TRS”) for the Marigold Gold Complex (“Marigold”) in Nevada, USA (the “2026 Marigold TRS”).
Click to Gallery
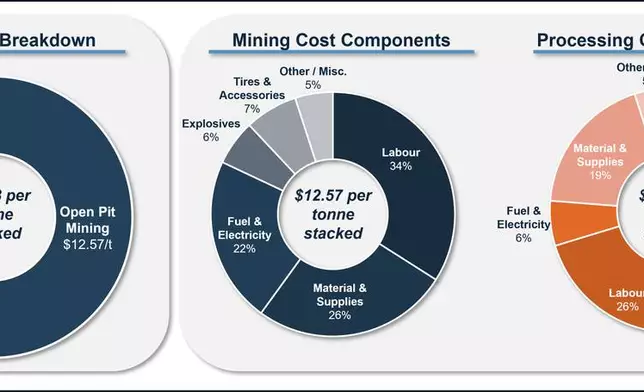
Figure 4: 2026 Marigold TRS – Cost Breakdown
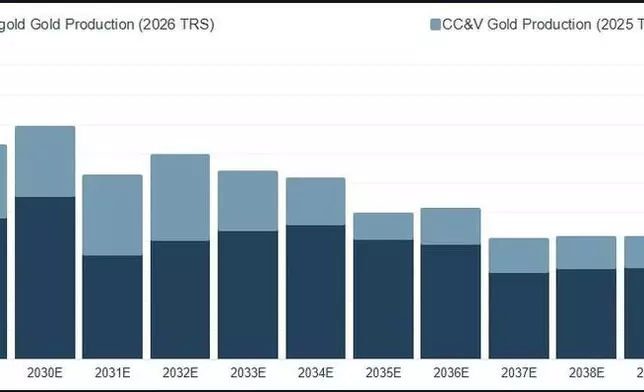
Figure 3: SSR Mining – Combined U.S. Production Profile
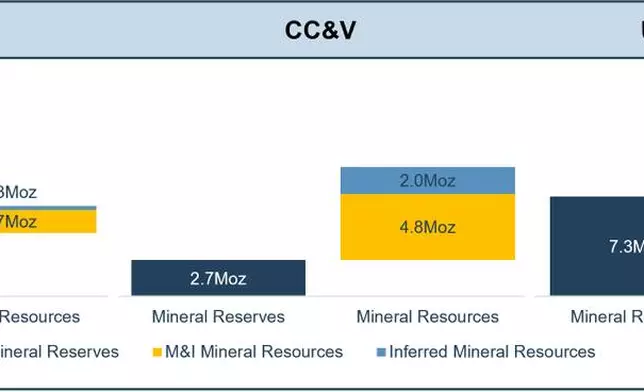
Figure 2: SSR Mining – MRMR by U.S. Asset
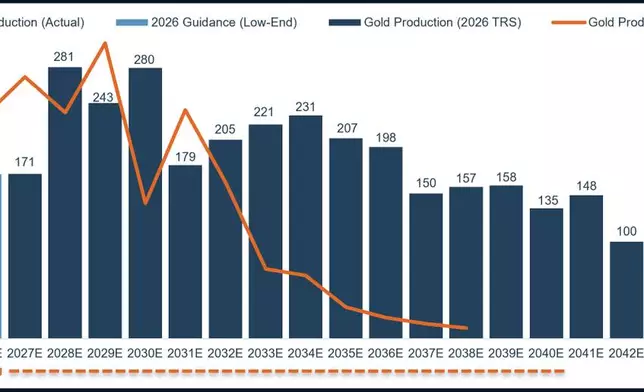
Figure 1: 2026 Marigold TRS – Production Summary (in koz)
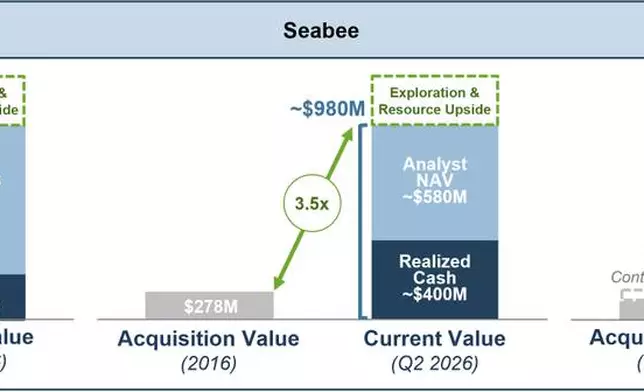
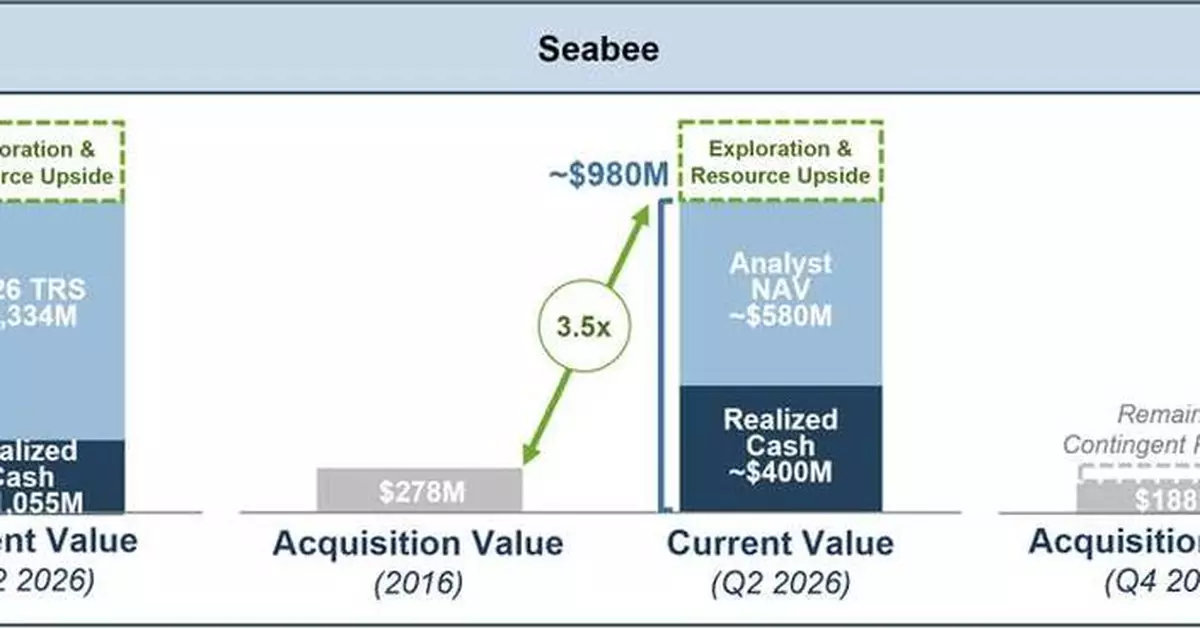
Figure 5: SSR Mining’s Proven M&A Track Record (8)
This press release features multimedia. View the full release here: https://www.businesswire.com/news/home/20261009381678/en/
Highlights of the 2026 Marigold TRS:(1,2)
Rod Antal, Executive Chairman of SSR Mining, said, “Today’s updated life of mine plan reinforces Marigold’s position as a premier, multi-decade asset in the United States. Over the next three years, we plan to invest in Marigold to modernize the operation for future success through fleet and heap leach pad expansions that aim to improve its operational flexibility and reliability.
Importantly, over the next five years we expect Marigold will average more than 230,000 ounces of gold production annually, aligned with the prior TRS expectations and supporting average annual gold production of approximately 360,000 ounces from our U.S. assets over that period. Longer-term, the mine is expected to average 200,000 ounces of gold production annually through 2040, delivering a more than 50% increase in life of mine production over the prior mine plan.
Investing in organic growth is one of the key pillars of our capital allocation strategy, and this TRS provides a clear pathway for us to execute on that strategy and create value for shareholders. This new mine plan increases Mineral Reserves by 43% as compared to year-end 2025 while Indicated and Inferred Resources remain essentially unchanged, demonstrating our track record of exploration and resource development success while highlighting further potential for additional mine life extension in the future.”
The TRS, with an effective date of May 1, 2026, has been prepared in accordance with S-K 1300 and will be available on October 13, 2026 on the Company’s website and on a Current Report on Form 8-K to be filed with the U.S. Securities and Exchange Commission (“SEC”).
Table 1: 2026 Marigold TRS – Key Metrics(3)
Table 2: 2026 Marigold TRS – After-Tax NPV Sensitivity
Marigold Mineral Reserves and Mineral Resources (“MRMR”)(7)
Marigold is located in southeastern Humboldt County, Nevada, United States on the Battle Mountain-Eureka trend, approximately 5 kilometers south-southwest of the town of Valmy, Nevada. The Marigold Complex includes the Marigold Mine and the Buffalo Valley and Trenton Canyon deposits. Buffalo Valley is located approximately 24 kilometers southwest of the main infrastructure at Marigold. Since commencing operations in 1989, Marigold has produced over 5 million ounces of gold.
Table 3: 2026 Marigold TRS – MRMR as of May 1, 2026
Combining Marigold with the Company’s CC&V gold mine in Colorado established SSR Mining as the third largest gold producer in the USA. Both operations now feature multi-decade mine lives and host significant Mineral Resource bases to support potential for future growth and extension.
2026 Marigold TRS Overview
Geological understanding of the Marigold Complex is supported by more than three decades of mining operations, extensive exploration programs, geologic mapping, geophysical surveys, metallurgical testing, production history, and ongoing resource definition drilling.
Mining & Processing
The 2026 Marigold life of mine plan features 15 years of active mining and 20 years of total production, inclusive of heap leach pad rinsing and drawdown. The Marigold Complex mine plan outlined in the 2026 Marigold TRS has five distinct areas of mining: the main Mackay pit (including the Red Dot and DG80 areas), the North Mackay pits, the Valmy pits, the New Millennium area, and Buffalo Valley. A separate mining fleet of 8 to 10 trucks and two hydraulic shovels was initially considered for Buffalo Valley, however, procuring additional trucks and loading units in 2027 allows for accelerated waste stripping at Marigold ahead of initial development at Buffalo Valley. Peak fleet size in the 2026 Marigold TRS is 45 haul trucks, six shovels and two loaders. This expanded fleet is then adequate to operate both Marigold and Buffalo Valley simultaneously over the life of mine and enables increased flexibility in mine planning going forward.
On average, the operating period from 2026 to 2040 includes average mining rates of approximately 380,000 tonnes per day (138.3 million tonnes per annum) with a life of mine strip ratio of 5.3:1. Stacking rates are expected to average approximately 20 million tonnes per annum at Marigold over the life of mine, while the Buffalo Valley heap leach facility is designed to accommodate stacking rates of up to 14 million tonnes per annum. The life of mine gold recovery across Marigold and Buffalo Valley is 72% over an average of 90 to 120 day leach cycle, with an average stacked grade of 0.44 grams per tonne. Life of mine gold production totals 3.34 million ounces, including approximately 0.3 million ounces of current work-in-progress inventory recovered over the life of mine.
The Buffalo Valley heap leach facility will be constructed and operated in a manner very similar to the main Marigold facility. Run of mine ore will be truck stacked in 7.5 meter to 12.5 meter lifts. Following heap leaching, pregnant solution will be pumped into three Carbon-in Column (CIC) trains for adsorption. Loaded carbon from the adsorption circuit will be transported to the Marigold elution facility for final recovery, with barren carbon then transported back to the Buffalo Valley facility. Buffalo Valley will require upgrades to the road connecting to main Marigold facilities, and will require the construction of approximately 14.5 kilometers of power line from the existing North Peak power line to service the project site.
Table 4: 2026 Marigold TRS – Operating Metrics Summary
Infrastructure
The Marigold Complex is accessed via a five kilometer public road connected to the U.S. Interstate Highway 80. Marigold is grid connected, while water for operations is supplied by three existing groundwater production wells. Mine dewatering wells are used to supplement production wells when needed. Where possible, operations at Buffalo Valley will leverage existing infrastructure at Marigold, including the maintenance facilities and administrative offices. A tailings storage facility (TSF) is present at Marigold but has been decommissioned since operations transitioned solely to heap leaching.
Operating Costs
Forecasted operating cost estimates related to the development of the 2026 Marigold TRS are derived from annual budgets and historical actuals over the long life of the current operation. The life of mine operating cost estimate for the Marigold Complex is $16.78 per tonne of stacked ore. Life of mine operating costs in the 2026 Marigold TRS do not account for non-cash inventory movements and other minor non-cash items that impact the Company’s calculation of cash costs and AISC.
Table 5: 2026 Marigold TRS – Mine Operating Cost Summary
Labor and diesel are the two largest components of operating costs at Marigold. Diesel prices for the economic analysis were based on the latest available consensus forward-looking price forecasts and compared to those used in other published studies. Near-term diesel price assumptions in the 2026 Marigold TRS average approximately $4.00/gallon before normalizing to $3.00/gallon over the long-term. The effective NSR royalty on the Marigold property in the 2026 Marigold TRS is approximately 6.9%, while the effective NSR royalty for the Buffalo Valley deposit is fixed at 3.5% over the life of mine.
Capital Costs
Total life of mine capital outlined in the 2026 Marigold TRS is $1,385 million, including $669 million in sustaining capital. Sustaining capital costs include:
Table 6: 2026 Marigold TRS – Total Capital Breakdown (2026+)
The life of mine growth capital at Marigold totals $542 million, including all capital associated with major leach pad expansion at Marigold, development of Buffalo Valley, and the expansion of the Marigold mining fleet. These investments support the development and mining of Buffalo Valley, as well as enable the execution of the extended Marigold life of mine plan.
Table 7: 2026 Marigold TRS – Growth Capital Breakdown (2026+)
The costs associated with reclamation and closure activities at Marigold are estimated to be $175 million, with the majority of these costs incurred from 2038 to the end of the current life of mine plan.
Additional Potential for Upside at Marigold
The 2026 Marigold TRS outlines 1.7 million ounces of gold Indicated Mineral Resources, exclusive of Mineral Reserves, and an additional 0.3 million ounces of gold Inferred Mineral Resources across the Marigold Complex. These Mineral Resources represent potential opportunities for future conversion to Mineral Reserves. Mineral Resources in the 2026 Marigold TRS were calculated using a gold price assumption of $2,500/oz.
SSR Mining continues to invest in resource development and exploration drilling across the Marigold Complex to evaluate future growth potential, particularly through the continued expansion of currently defined Mineral Reserve pits. In 2026, SSR Mining planned for more than 10 kilometers of drilling on brownfield targets across the property, including in the underexplored southern end of the property where new discoveries could support further heap leach expansions to further optimize ore and waste movements.
Additionally, potential increases to the gold price assumptions used in the calculation of Mineral Reserves and Resources could add to current MRMR totals at Marigold in the future.
Assumptions
All figures are in U.S. dollars, unless otherwise noted. The gold price used in the calculation of Mineral Reserves was $2,200 per ounce and the gold price used in the calculation of Mineral Resources was $2,500 per ounce. The TRS is based on gold prices of: 2026 - $4,637/oz; 2027 - $4,794/oz; 2028 - $4,616/oz; 2029 - $4,355/oz; 2030 - $3,991/oz; and long-term - $3,710/oz. Diesel price assumptions used in the TRS were: $4.00/gal for 2027 and 2028, $3.50/gal in 2029 and $3.00/gal long-term. All references to tonnage in this press release are in metric tonnes unless otherwise noted. Key assumptions used in the preparation of the TRS are subject to risks and uncertainties described under “Cautionary Note Regarding Forward-Looking Information and Statements”.
Marigold Technical Report Summary
The Marigold TRS is expected to be included as an exhibit to our Current Report on Form 8-K that is filed with the SEC by October 13, 2026 and will be available for review on EDGAR at sec.gov at that time. This press release does not purport to be a complete summary of the Marigold TRS and is qualified in its entirety by reference to the Marigold TRS that we will file with the SEC. You should read this press release in conjunction with the Marigold TRS, including the qualifications and limitations described therein, as there may be information in the Marigold TRS that may be important.
About SSR Mining
SSR Mining Inc. is a free-cash-flow-focused gold and silver mining company and the third-largest gold producer in the United States. SSR Mining has a diversified portfolio of operating, development and exploration assets across the Americas, including four operating mines in the USA, Canada, and Argentina. In 2026, SSR Mining is expected to produce between 450,000 and 535,000 Gold Equivalent Ounces. The Company is headquartered in Denver, Colorado and is listed under the ticker symbol SSRM on the Nasdaq Stock Market and the Toronto Stock Exchange.
For more information, please visit: www.ssrmining.com.
Cautionary Note Regarding Forward-Looking Information and Statements:
Except for statements of historical fact relating to us, certain statements contained in this news release constitute forward-looking statements, forward-looking information, future oriented financial information, or financial outlooks (collectively “forward-looking information”) within the meaning of applicable securities laws. Forward-looking information may be contained in this document and our other public filings. Forward-looking information relates to statements concerning our outlook and anticipated events or results and in some cases, can be identified by terminology such as “may”, “will”, “could”, “should”, “expect”, “plan”, “anticipate”, “believe”, “intend”, “estimate”, “projects”, “predict”, “potential”, “continue” or other similar expressions, as well as statements written in the future tense or that are not historical facts.
Forward-looking information in this news release includes any statements concerning, among other things: all information related to the Company’s Marigold operations, including forecasts and outlook; preliminary cost reporting in this document; timing, production, operating, cost, and capital expenditure guidance; our operational and development targets and catalysts and the impact of any suspensions on operations; growth initiatives, the results of any gold reconciliations; the ability to discover additional oxide gold ore; the generation of free cash flow and returning cash to shareholders, including via share repurchases or dividends; matters relating to proposed exploration; communications with local stakeholders; maintaining community and government relations; negotiation and completion of transactions; commodity prices; Mineral Resources, Mineral Reserves, conversion of Mineral Resources, realization of Mineral Reserves, and the existence or realization of Mineral Resource estimates; the development approach; the timing and amount of future production; the timing of studies, announcements, and analysis; the timing of construction and development of proposed mines and process facilities; capital and operating expenditures; economic conditions; availability of sufficient financing; exploration plans; receipt of regulatory approvals; timing and impact surrounding suspension or interruption of operations as a result of regulatory requirements or actions by governmental authority; and any and all other timing, exploration, development, operational, financial, budgetary, economic, legal, social, environmental, regulatory, and political matters that may influence or be influenced by future events or conditions. The estimation of mineral resources is inherently uncertain and involves subjective judgments about many relevant factors. The accuracy of any such estimates is a function of the quantity and quality of available data, and of the assumptions made and judgments used in engineering and geological interpretation (including estimated future production from Marigold, the anticipated tonnages and grades that will be mined and the estimated level of recovery that will be realized), which may prove to be unreliable and depend, to a certain extent, upon the analysis of drilling results and statistical inferences that may ultimately prove to be inaccurate.
Such forward-looking information is subject to various risks and uncertainties and based on a number of material factors and assumptions, which could cause actual results and experience to differ materially from anticipated results or expectations expressed in this news release, including, but not limited in any manner to, those disclosed from time to time in our reports filed with the SEC on EDGAR, including the “Risk Factors” section of our most recent Annual Report on Form 10-K and subsequent Quarterly Reports on Form 10-Q, as applicable, and the Canadian securities regulatory authorities on SEDAR+, and include: the assumptions made in respect of the Company’s Marigold operations; the inherent speculative nature of exploration results; the ability to explore; local and global political and economic conditions; governmental and regulatory requirements and actions by governmental authorities, including changes in government policy, government ownership requirements, changes in environmental, tax and other laws or regulations and the interpretation thereof; communications with local stakeholders; maintaining community and governmental relations; status of negotiations of joint ventures; weather conditions at our operations; commodity prices; the ultimate determination of and realization of Mineral Reserves; existence or realization of Mineral Resources; the development approach; availability and receipt of required approvals, titles, licenses and permits; sufficient working capital to develop and operate the mines and implement development plans; access to adequate services and supplies; foreign currency exchange rates; interest rates; access to capital markets and associated cost of funds; availability of a qualified work force; ability to negotiate, finalize, and execute relevant agreements; the Company’s ability to efficiently integrate acquired mines and businesses and to manage the costs related to any such integration, or to retain key technical, professional or management personnel; lack of social opposition to our mines or facilities; lack of legal challenges with respect to our properties; the timing and amount of future production; the ability to meet production, cost, and capital expenditure targets; timing and ability to produce studies and analyses; capital and operating expenditures; economic conditions; availability of sufficient financing; the ultimate ability to mine, process, and sell mineral products on economically favorable terms; and any and all other timing, exploration, development, operational, financial, budgetary, economic, legal, social, geopolitical, regulatory and political factors that may influence future events or conditions. While we consider these factors and assumptions to be reasonable based on information currently available to us, they may prove to be incorrect.
The above list is not exhaustive of the factors that may affect any of the Company’s forward-looking information. You should not place undue reliance on forward-looking information. Forward-looking information are based on certain key expectations and assumptions made by us. Although we believe that the expectations and assumptions on which such forward-looking information are based are reasonable, undue reliance should not be placed on the forward-looking information because we can give no assurance that they will prove to be correct. Other than as required by law, we do not intend, and undertake no obligation to update any forward-looking information to reflect, among other things, new information or future events. The information contained on, or that may be accessed through, our website is not incorporated by reference into, and is not a part of, this document.
Qualified Persons
The scientific and technical information concerning our mineral projects in this news release have been reviewed and verified by SLR International Corporation, a “qualified person” under subpart 1 of Regulation S-K 1300 (“S-K 1300”) and National Instrument 43-101 – Standards of Disclosure for Mineral Projects (“NI 43-101”). For a description of the key assumptions, parameters and methods used to estimate Mineral Reserves and Mineral Resources included in this news release, as well as data verification procedures and a general discussion of the extent to which the estimates may be affected by any known environmental, permitting, legal, title, taxation, sociopolitical, marketing or other relevant factors, please review the Technical Report Summaries for the properties discussed in this news release, which are available under the Company’s corporate profile on EDGAR atwww.sec.gov.
Supplemental Mineral Reserve and Mineral Resource Information
Marigold’s Mineral Reserves and Mineral Resources have been classified in accordance with the definitions for Mineral Resources in S-K 1300. Mineral Resources are presented on a project basis and have an effective date of May 1, 2026. Mineral Reserves and Mineral Resources have been reported on a 100% basis as SSR Mining wholly owns the property.
The TRS contains detailed descriptions of data verification, sampling and assay procedures, quality assurance and quality control measures, key assumptions, parameters, risks and other factors supporting the mineral resource and mineral reserve estimates and the economic analysis.
Mineral Resources, which are not Mineral Reserves, do not have demonstrated economic viability. The estimate of Mineral Resources may be materially affected by environmental, permitting, legal, title, market or other relevant issues. The deposit has been classified as Indicated and Inferred based on drill spacing appropriate to the deposit and mineralization style. The quantity and grade of reported Inferred resources are uncertain in nature, and there has not been sufficient work to define these Inferred Mineral Resources as Indicated or Measured resources. There is no certainty that any part of a mineral resource will ever be converted into mineral reserves.
The following tables provide a summary of Mineral Reserves and Mineral Resources for Marigold with an effective date of May 1, 2026 as included within the 2026 Marigold TRS:
For Information regarding CC&V’s Mineral Reserves and Mineral Resources, refer to Item 2. Properties in the Company’s Annual Report on Form 10-K for the year ended December 31, 2025 filed on February 17, 2026 and the Technical Report Summary included as an exhibit to our Annual Report on Form 10-K.
The following tables provide a summary of Mineral Reserves and Mineral Resources for CC&V for the year ended December 31, 2025 as included within the Company’s Annual Report:
Cautionary Note Regarding Non-GAAP Measures
We have included certain non-GAAP performance measures throughout this document to assist in understanding our financial results. These performance measures are employed by us to measure our operating and economic performance internally and to assist in decision-making, as well as to provide key performance information to senior management. We believe that, in addition to measures prepared in accordance with GAAP, certain investors and other stakeholders will find this information useful to evaluate our operating and financial performance; however, these non-GAAP performance measures do not have any standardized meaning. These performance measures are intended to provide additional information and should not be considered in isolation or as a substitute for measures of performance prepared in accordance with GAAP. Our definitions of our non-GAAP financial measures may not be comparable to similarly titled measures reported by other companies. These non-GAAP measures should be read in conjunction with our condensed consolidated interim financial statements.
Cash costs, AISC per ounce sold, and free cash flow are Non-GAAP Measures with no standardized definition under U.S. GAAP.
Non-GAAP Measure - Cash Costs and AISC
Cash Costs and All-In Sustaining Costs (“AISC”) per payable ounce of gold and respective unit cost measures are non-U.S. GAAP metrics developed by the World Gold Council to provide transparency into the costs associated with producing gold and provide a standard for comparison across the industry. The World Gold Council is a market development organization for the gold industry.
The Company uses cash costs per ounce of precious metals sold and AISC per ounce of precious metals to monitor its operating performance internally. The most directly comparable measure prepared in accordance with GAAP is cost of sales. The Company believes this measure provides investors and analysts with useful information about its underlying cash costs of operations and the impact of by-product credits on its cost structure. The Company also believes these are relevant metrics used to understand its operating profitability. When deriving the cost of sales associated with an ounce of precious metal, the Company includes by-product credits, which allows management and other stakeholders to assess the net costs of gold and silver production.
AISC includes total cost of sales incurred at the Company's mining operations, which forms the basis of cash costs. Additionally, the Company includes sustaining capital expenditures, sustaining mine-site exploration and evaluation costs, reclamation cost accretion and amortization, and general and administrative expenses. This measure seeks to reflect the ongoing cost of gold and silver production from current operations; therefore, growth capital is excluded. The Company determines sustaining capital to be capital expenditures that are necessary to maintain current production and execute the current mine plan. The Company determines growth capital to be those payments used to develop new operations or related to projects at existing operations where those projects will materially benefit the operation.
The Company believes that AISC provides additional information to management and stakeholders that provides visibility to better define the total costs associated with production and better understanding of the economics of the Company's operations and performance compared to other producers. In deriving the number of ounces of precious metal sold, the Company considers the physical ounces available for sale after the treatment and refining process, commonly referred to as payable metal, as this is what is sold to third parties.
The following tables provide a reconciliation of Cost of sales to cash costs and AISC used in the 2026 Marigold TRS:
Non-GAAP Measure - Free Cash Flow and Mine Site Free Cash Flow
The Company uses free cash flow and mine site free cash flow to supplement information in its condensed consolidated financial statements. The most directly comparable financial measure prepared in accordance with GAAP to free cash flow is cash provided by operating activities and the most directly comparable financial measure prepared in accordance with GAAP to mine site free cash flow is mine segment revenue. The Company believes that in addition to measures prepared in accordance with GAAP, certain investors and analysts use this information to evaluate the ability of the Company to generate cash flow after capital investments and build the Company's cash resources and, with respect to one of its mine segments, to evaluate the cash generated from a mine. The Company calculates free cash flow by deducting cash capital spending from cash generated by operating activities. The Company does not deduct payments made for business acquisitions. The Company calculates mine site free cash flow by deducting cost of sales, exploration, evaluation, and reclamation expenditures, cash care and maintenance, capital expenditures and taxes from revenue from a particular segment.
The following table provides a reconciliation of cash provided by operating activities to free cash flow as shown in Table 1:
The Company uses mine site free cash flow to supplement information in its condensed consolidated financial statements. The Company calculates mine site free cash flow as revenue less cost of sales, exploration, evaluation, and reclamation expenditures, cash care and maintenance, capital expenditures and taxes. We believe presenting asset level revenue minus large cash expenditures will be useful for investors because it represents a view of how much cash is actually generated and spent that is directly attributable to a specific site.
The following table provides a calculation of mine Site Free Cash Flow for Marigold, Seabee and CC&V since acquisition through June 30, 2026:
2026 Marigold TRS – Life of Mine Cash Flow Model(4,5)
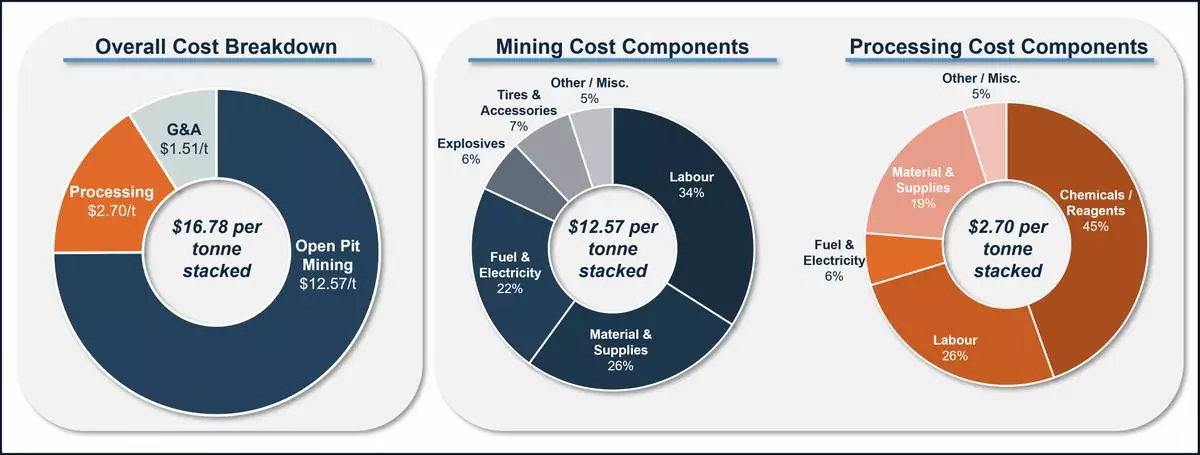
Figure 4: 2026 Marigold TRS – Cost Breakdown
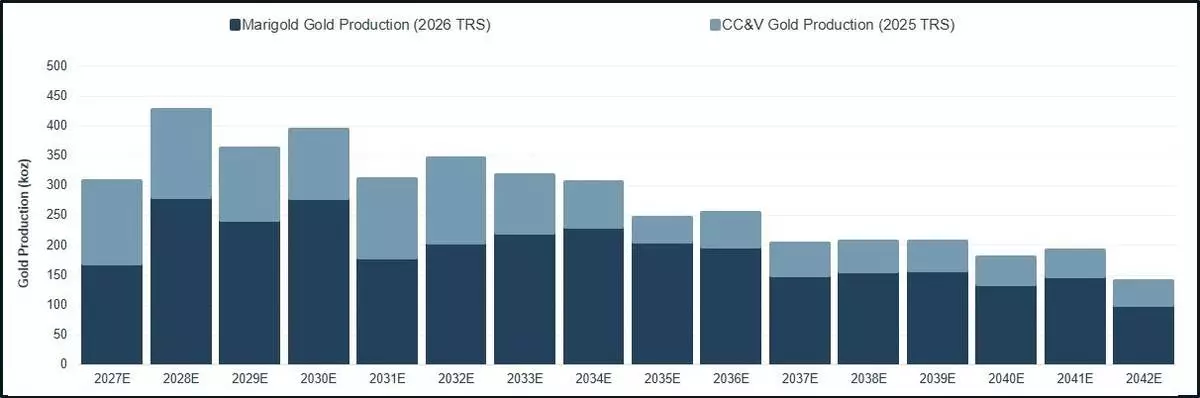
Figure 3: SSR Mining – Combined U.S. Production Profile
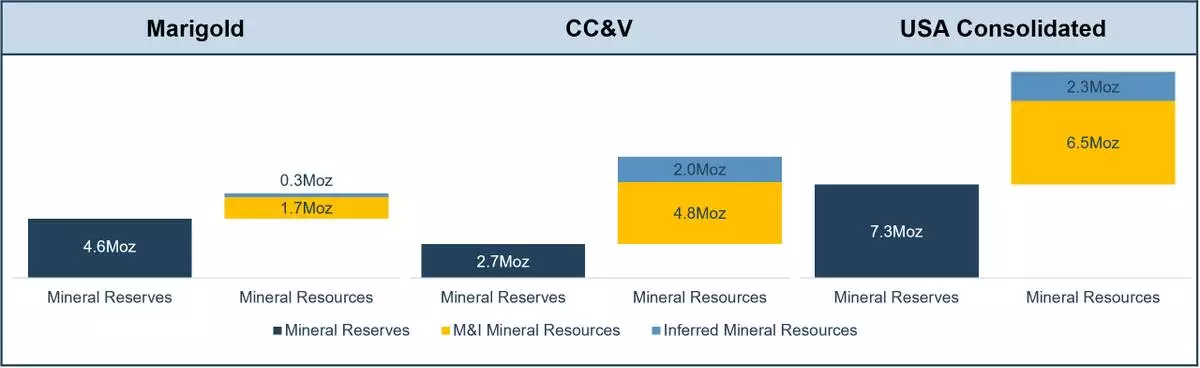
Figure 2: SSR Mining – MRMR by U.S. Asset
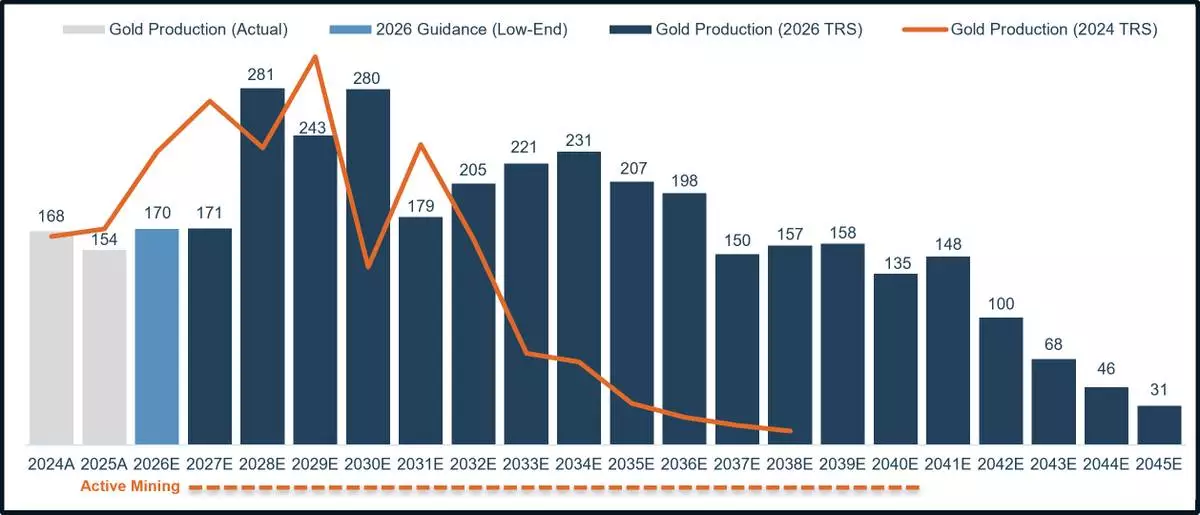
Figure 1: 2026 Marigold TRS – Production Summary (in koz)
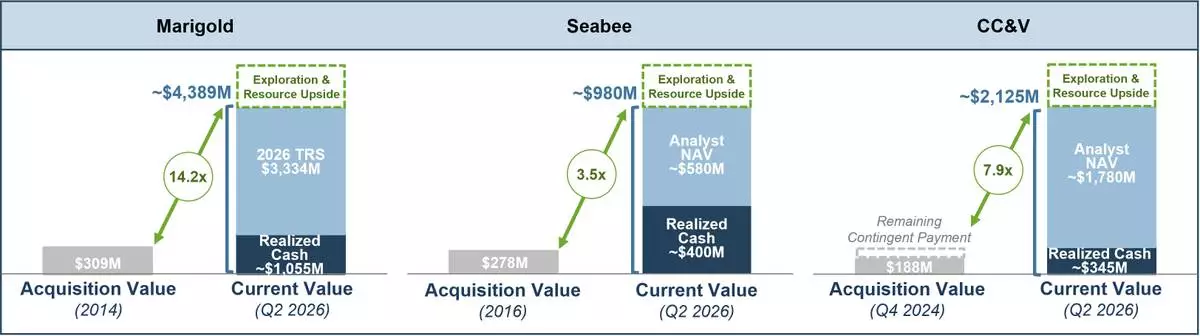
Figure 5: SSR Mining’s Proven M&A Track Record (8)