
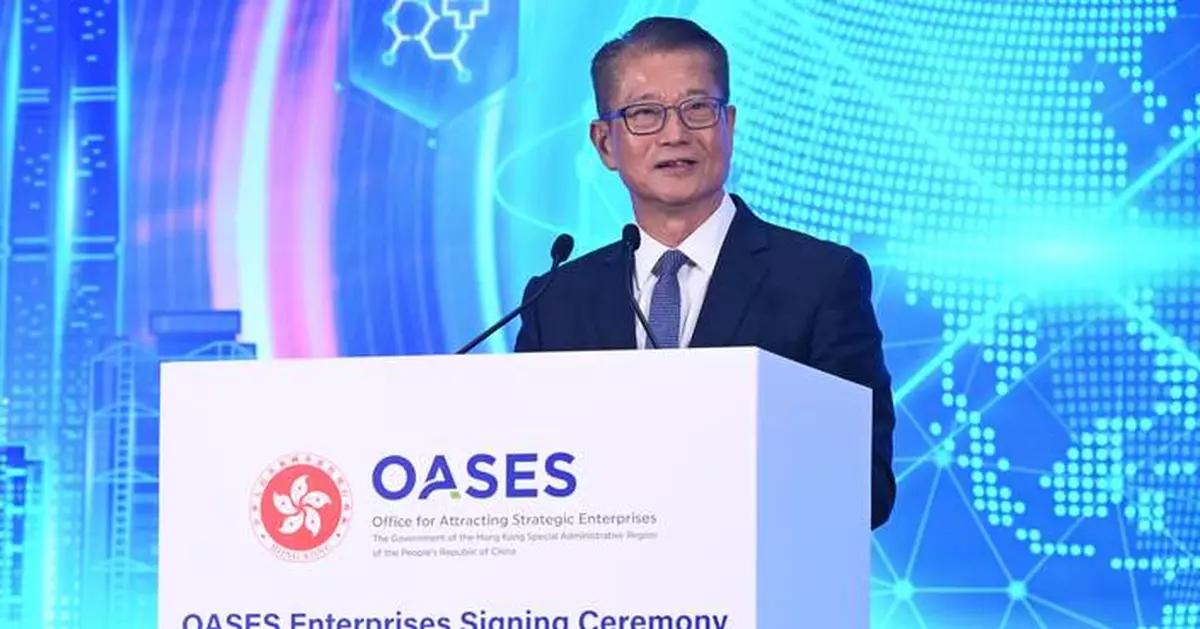
Speech by FS at OASES Enterprises Signing Ceremony
Following is the speech by the Financial Secretary, Mr Paul Chan, at the OASES Enterprises Signing Ceremony today (October 22):
Click to Gallery
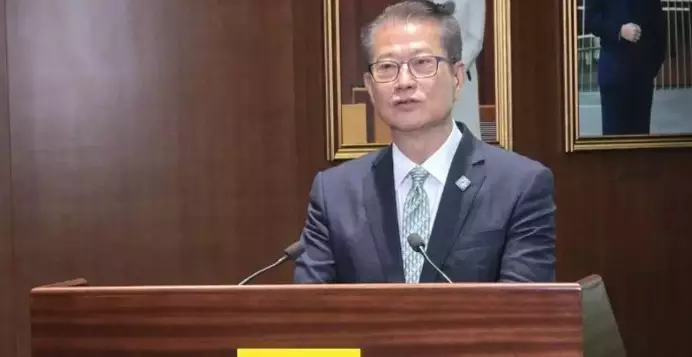
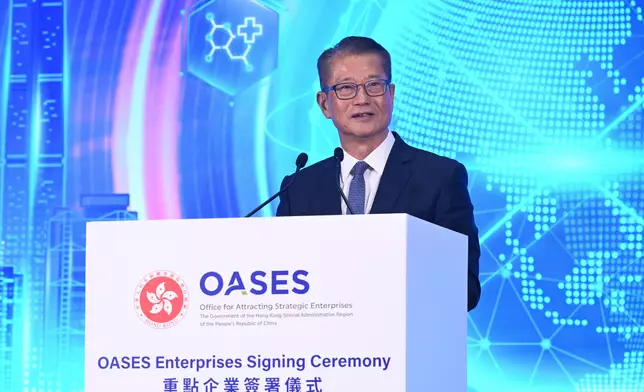
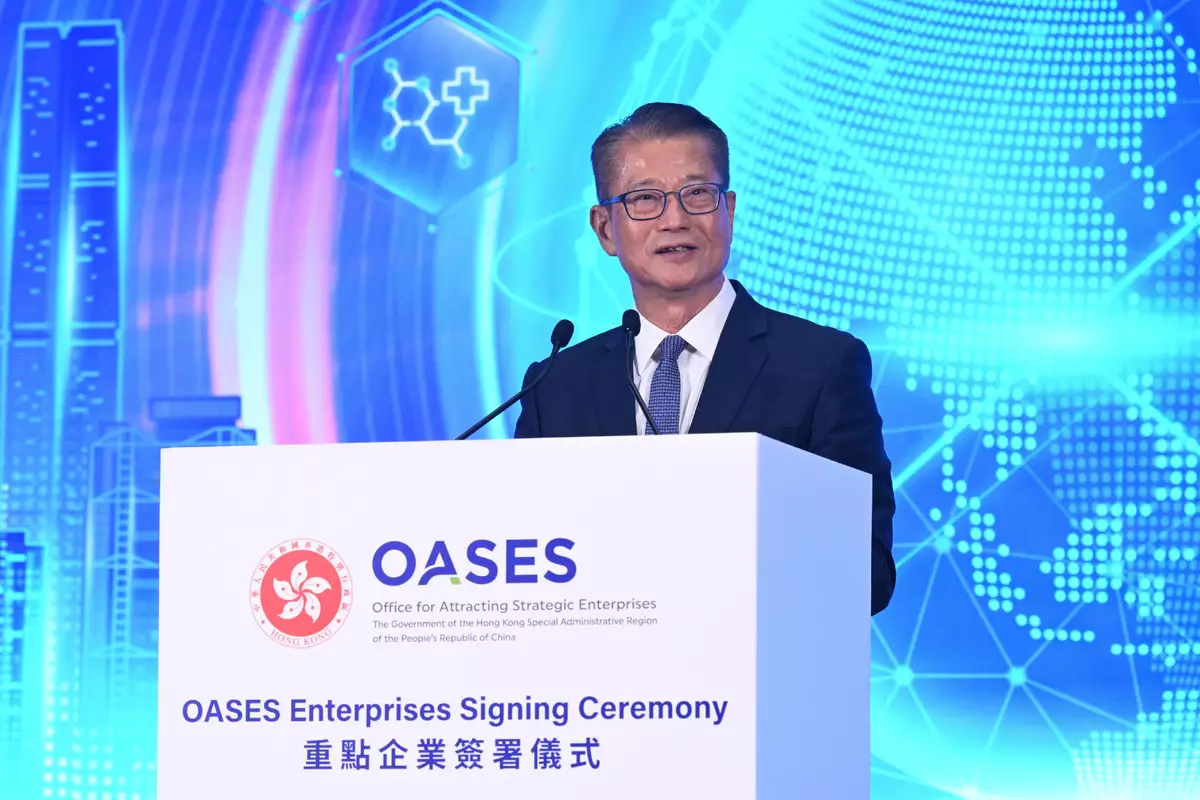
The Financial Secretary, Mr Paul Chan. Photo source: reference image
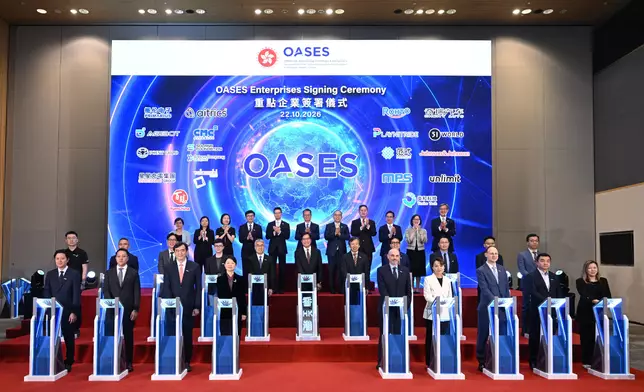
Speech by FS at OASES Enterprises Signing Ceremony Source: HKSAR Government Press Releases
Speech by FS at OASES Enterprises Signing Ceremony Source: HKSAR Government Press Releases
The Financial Secretary, Mr Paul Chan. Photo source: reference image
Peter (Director-General of the Office for Attracting Strategic Enterprises (OASES), Mr Peter Yan), government colleagues, strategic enterprise partners, distinguished guests, ladies and gentlemen,
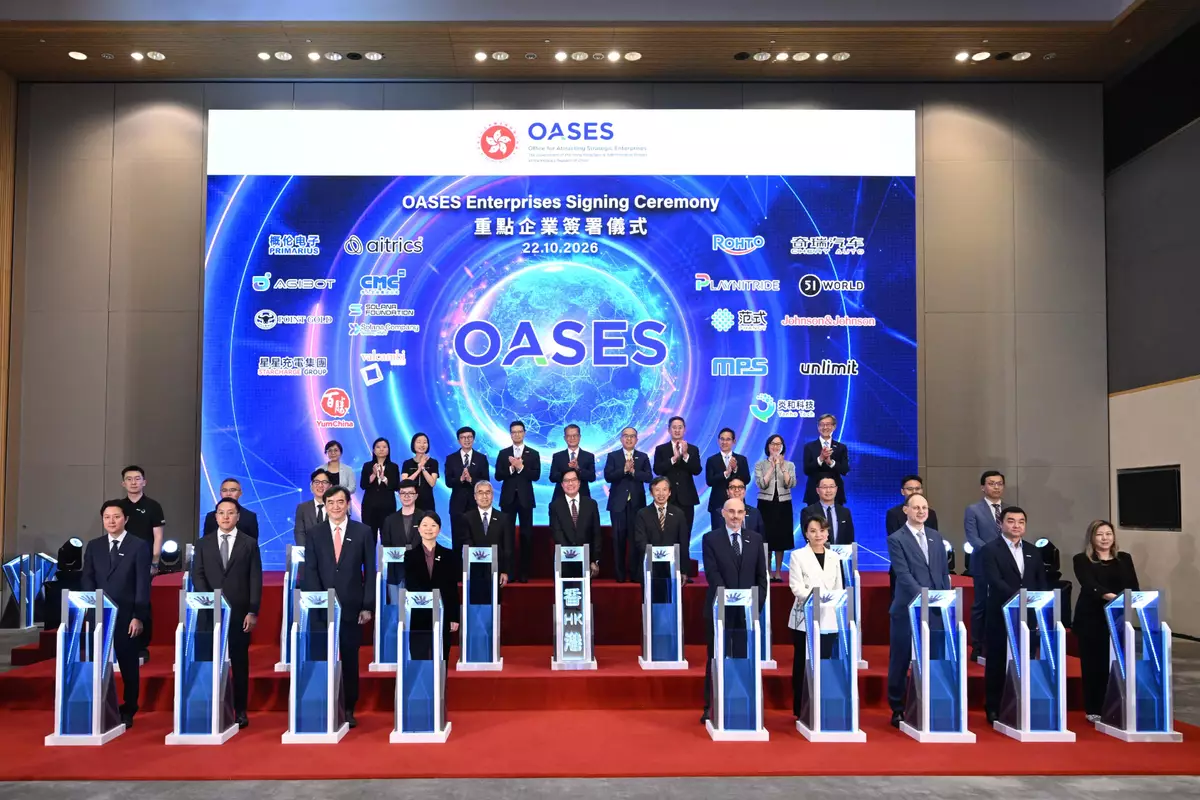
Good afternoon. A very warm welcome to our 18 new strategic enterprise partners.
Your businesses cover a remarkably wide range of sectors, from advanced manufacturing and new energy to artificial intelligence, life and health technology, fintech, and cultural and creative technology. Several of you have market capitalisation or valuation exceeding HK$100 billion. And all of you bring capabilities that will help shape the next stage of Hong Kong's development.
Today, half of our new partners come from the Chinese Mainland, while the other half from various parts of the world. That diversity speaks to Hong Kong's role: a place where businesses, talent and ideas from around the world come together to prosper.
Together, with enterprises in earlier batches, the 142 strategic enterprises are expected to bring in some HK$84 billion of investment and create about 27,000 jobs. We appreciate your contributions, and look forward to working with you to turn them into lasting commercial success and real benefits for the community.
Indeed, the growth of our strategic enterprises has been impressive. Consider the first six batches of enterprises. Their total investment has exceeded expectations by 30 per cent, while the jobs created by 34 per cent. Altogether, they have taken up more than 2.8 million square feet of commercial and industrial space.
Yet these figures tell only part of the story. What matters is the difference these enterprises can make in driving our innovation and technology sector forward, providing new impetus to our economy and employment, as well as solutions that make people live better.
For example, one of the strategic enterprises in this batch has developed real-time AI-empowered risk scores to predict patient deterioration in general wards and intensive care units, allowing medical intervention to come much earlier.
Another strategic enterprise will deploy its AI+Smart vehicle technologies and Internet of Vehicles applications in Hong Kong to accelerate the wider adoption of EVs (electronic vehicles), while using the city as a testing ground to advance green and smart mobility in the region.
This is the kind of impact we would like to see. And we are determined to create the conditions for more impact, by connecting finance, research, talent and industry more effectively, and by making it easier for enterprises to scale up their operations as well as products and services.
As we take forward Hong Kong's First Five-Year Plan, innovation and technology is a key priority within our "four centres and one hub" development framework. We will put our financial strengths to work for technological innovation, helping enterprises secure capital as they develop, commercialise and expand. That is what we mean by "Finance+": finance empowering innovation and the real economy.
The Northern Metropolis will provide the space for realising that ambition. We are developing three university towns there to bring education, research, talent development and industry closer together. This will strengthen collaboration and accelerate the journey from laboratory discoveries to market-ready solutions.
We are also strengthening these links across the Greater Bay Area. Through the Hetao Co-operation Zone, we are making it easier for people, goods, capital, data and samples to flow across the boundary.
Take biomedicine as an example. Smoother cross-boundary flows of research data and biological samples will support research and development. And the Mainland and Hong Kong authorities are stepping up collaboration on clinical trials and drug approvals. These efforts will help companies bring new treatments to patients more quickly, both on the Mainland and in the international markets. No wonder many global pharmaceutical firms are choosing Hong Kong as their R&D (research and development) hub and regional base.
Ladies and gentlemen, our finance and innovation ecosystem is open to the region, and open to the world. Openness is at the heart of who we are. We thrive on international connectivity and the free flow of goods, capital, information and, above all, talent.
With each new strategic enterprise, this ecosystem grows stronger. High-quality enterprises attract talented people, who bring fresh ideas and draw more businesses to Hong Kong. This virtuous cycle creates more opportunities for businesses and innovators.
To our new partners, our invitation is simple: build your business here. Bring your research, nurture your talent, and use Hong Kong as a springboard to take your innovations further.
Your next breakthrough may well begin here in Hong Kong, with an impact that reaches far beyond our shores. Let us work together to turn that promise into greater success, for your business and for Hong Kong.
Thank you very much.
Speech by FS at OASES Enterprises Signing Ceremony Source: HKSAR Government Press Releases
Speech by FS at OASES Enterprises Signing Ceremony Source: HKSAR Government Press Releases