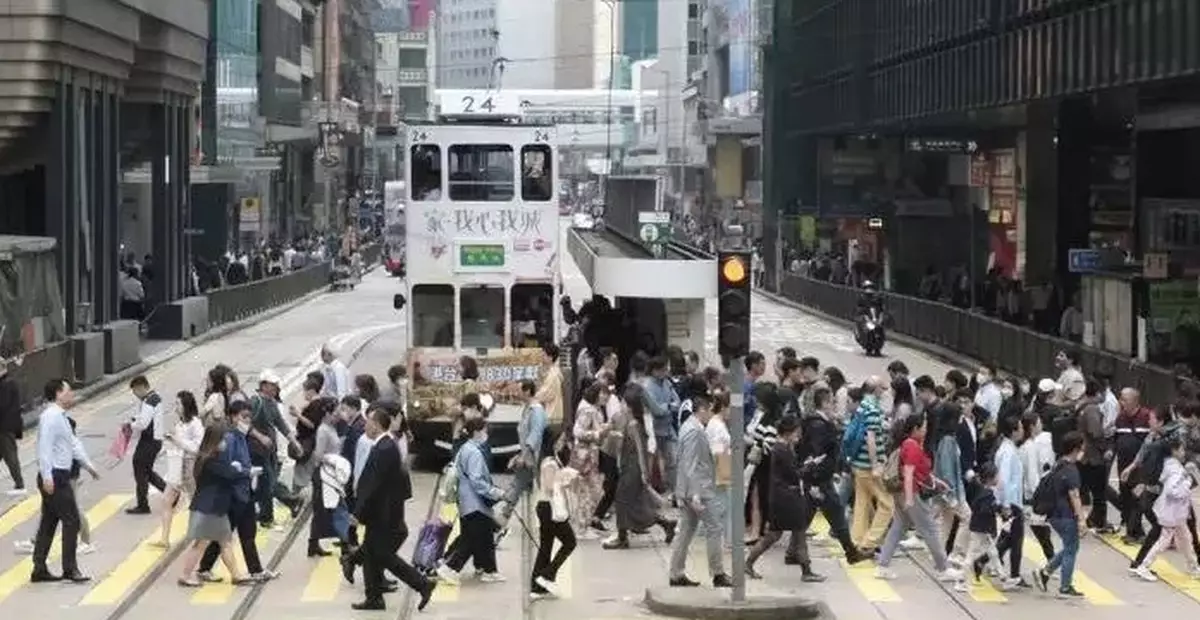
Unemployment and underemployment statistics for July - September 2026
According to the latest labour force statistics (i.e. provisional figures for July - September 2026) released today (October 22) by the Census and Statistics Department (C&SD), the seasonally adjusted unemployment rate increased from 3.8% in June - August 2026 to 3.9% in July - September 2026. The underemployment rate also increased from 1.9% in June - August 2026 to 2.0% in July - September 2026.
Click to Gallery
The Census and Statistics Department. Photo source: reference image
Photo source: reference image
The Secretary for Labour and Welfare, Mr Chris Sun. Photo source: reference image
Photo source: reference image

The Census and Statistics Department. Photo source: reference image
Comparing July - September 2026 with June - August 2026, movements in the unemployment rate (not seasonally adjusted) in different industry sectors varied, with more distinct increases observed in the social work activities sector, and warehousing and support activities for transportation sector. As to the underemployment rate, increases were mainly seen in the food and beverage service activities sector and retail sector.
Total employment increased by around 3 000 from 3 652 000 in June - August 2026 to 3 655 000 in July - September 2026. Over the same period, the labour force also increased by around 4 100 from 3 805 900 to 3 810 000.
The number of unemployed persons (not seasonally adjusted) increased by around 1 100 from 153 900 in June - August 2026 to 155 000 in July - September 2026. Over the same period, the number of underemployed persons also increased by around 2 900 from 72 100 to 75 000.

Photo source: reference image
Commentary
Commenting on the latest unemployment figures, the Secretary for Labour and Welfare, Mr Chris Sun, said, "The seasonally adjusted unemployment rate edged up by 0.1 percentage point over the preceding three-month period to 3.9% in July - September 2026. The underemployment rate also rose slightly by 0.1 percentage point to 2.0%. Over the same period, both the labour force and total employment increased further amid the continued influx of fresh graduates and school leavers into the labour market."

The Secretary for Labour and Welfare, Mr Chris Sun. Photo source: reference image
Looking ahead, Mr Sun said, "The sustained expansion of the local economy, improving business sentiment and continued growth in visitor arrivals are expected to underpin the overall employment situation, particularly in the consumption- and tourism-related sectors. Meanwhile, the Government will continue to closely monitor the potential impacts of external uncertainties on corporate hiring sentiments and provide job-seekers with appropriate support."
Further information
The unemployment and underemployment statistics were compiled from the findings of the continuous General Household Survey.
In the survey, the definitions used in measuring unemployment and underemployment follow closely those recommended by the International Labour Organization. The employed population covers all employers, self-employed persons, employees (including full-time, part-time, casual workers, etc.) and unpaid family workers. Unemployed persons by industry (or occupation) are classified according to their previous industry (or occupation).
The survey for July - September 2026 covered a sample of some 25 000 households or 65 000 persons, selected in accordance with a scientifically designed sampling scheme to represent the population of Hong Kong. Labour force statistics compiled from this sample represented the situation in the moving three-month period of July to September 2026.

Photo source: reference image
Data on labour force characteristics were obtained from the survey by interviewing each member aged 15 or over in the sampled households.
Statistical tables on the latest labour force statistics can be downloaded at the website of the C&SD (www.censtatd.gov.hk/en/scode200.html). More detailed analysis of the labour force characteristics is given in the "Quarterly Report on General Household Survey" which is published four times a year. The latest issue of the report contains statistics for the quarter April - June 2026 while the next issue covering the quarter July - September 2026 will be available by end November 2026. Users can also browse and download this publication at the website of the C&SD (www.censtatd.gov.hk/en/EIndexbySubject.html?pcode=B1050001&scode=200).
For enquiries about labour force statistics, please contact the General Household Survey Section (3) of the C&SD (Tel: 2887 5508 or email: ghs@censtatd.gov.hk).
Consumer Price Indices for September 2026
The Census and Statistics Department (C&SD) released today (October 22) the Consumer Price Index (CPI) figures for September 2026. According to the Composite CPI, overall consumer prices rose by 1.9% in September 2026 over the same month a year earlier, larger than the corresponding increase (1.7%) in August 2026. Netting out the effects of all Government's one-off relief measures, the year-on-year rate of increase in the Composite CPI (i.e. the underlying inflation rate) in September 2026 was 2.1%, also larger than that in August 2026 (1.9%). The larger increase in September 2026 was mainly due to the accelerated increases in inbound and outbound transport fares and the charges for package holidays.
The Census and Statistics Department. Photo source: reference image
On a seasonally adjusted basis, the average monthly rate of increase in the Composite CPI for the 3-month period ending September 2026 was 0.2%, the same as that for the 3-month period ending August 2026. Netting out the effects of all Government's one-off relief measures, the corresponding rates of increase were both 0.2%.
Analysed by sub-index, the year-on-year rates of increase in the CPI(A), CPI(B) and CPI(C) were 1.4%, 2.0% and 2.3% respectively in September 2026, as compared to 1.2%, 1.8% and 1.9% respectively in August 2026. Netting out the effects of all Government's one-off relief measures, the year-on-year rates of increase in the CPI(A), CPI(B) and CPI(C) were 1.7%, 2.2% and 2.4% respectively in September 2026, as compared to 1.6%, 2.0% and 2.0% respectively in August 2026.
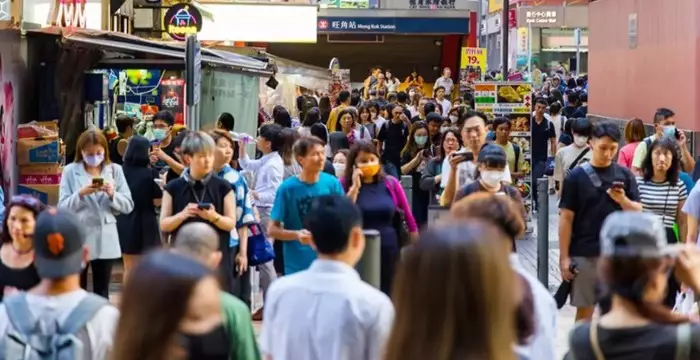
Photo source: reference image
On a seasonally adjusted basis, for the 3-month period ending September 2026, the average monthly rates of increase in the CPI(A), CPI(B) and CPI(C) were all 0.2%. The corresponding rates of increase for the 3-month period ending August 2026 were 0.2%, 0.1% and 0.1% respectively. Netting out the effects of all Government's one-off relief measures, the average monthly rates of increase in the seasonally adjusted CPI(A), CPI(B) and CPI(C) for the 3-month period ending September 2026 were 0.1%, 0.2% and 0.2% respectively, and the corresponding rates of increase for the 3-month period ending August 2026 were 0.2%, 0.1% and 0.1% respectively.
Amongst the various components of the Composite CPI, year-on-year increases in prices were recorded in September 2026 for electricity, gas and water (12.9%), miscellaneous services (5.3%), transport (5.2%), miscellaneous goods (2.1%), durable goods (1.1%), meals out and takeaway food (1.0%), clothing and footwear (0.3%), and housing (0.2%).
On the other hand, year-on-year decreases in the components of the Composite CPI were recorded in September 2026 for alcoholic drinks and tobacco (-0.4%), and basic food (-0.2%).

Photo source: reference image
Taking the first 9 months of 2026 together, the Composite CPI rose by 1.7% over the same period a year earlier. The respective increases in the CPI(A), CPI(B) and CPI(C) were 1.5%, 1.8% and 1.9% respectively. The corresponding increases after netting out the effects of all Government's one-off relief measures were 1.7%, 1.4%, 1.8% and 1.9% respectively.
In the third quarter of 2026, the Composite CPI rose by 1.7% over the same period a year earlier, while the CPI(A), CPI(B) and CPI(C) rose by 1.3%, 1.9% and 2.1% respectively. The corresponding increases after netting out the effects of all Government's one-off relief measures were 2.0%, 1.7%, 2.1% and 2.2% respectively.
For the 12 months ending September 2026, the Composite CPI on average rose by 1.6% over the same period a year earlier. The respective increases in the CPI(A), CPI(B) and CPI(C) were 1.5%, 1.7% and 1.7% respectively. The corresponding increases after netting out the effects of all Government's one-off relief measures were 1.6%, 1.3%, 1.6% and 1.7% respectively.

Photo source: reference image
Commentary
A Government spokesman said that the underlying Composite CPI rose by 2.1% in September over a year earlier, up from 1.9% in the preceding month, largely driven by faster price increases in fuel-related items. Yet, price increases of other components were largely modest, thus keeping overall inflation moderate.
Looking ahead, consumer price inflation will remain under upward pressure, as persistently elevated international oil prices feed through to fuel-related components amid ongoing geopolitical tension in the Middle East. Yet, as price pressures on other fronts are expected to remain largely contained, overall inflation should stay moderate.

Photo source: reference image
Further information
More detailed statistics are given in the "Monthly Report on the Consumer Price Index". Users can browse and download this publication at the website of the C&SD (www.censtatd.gov.hk/en/EIndexbySubject.html?pcode=B1060001&scode=270).
For enquiries about the CPIs, please contact the Consumer Price Index Section of the C&SD (Tel: 3903 7374 or email: cpi@censtatd.gov.hk).