

EDITORS/NEWS DIRECTORS:
New federal student loan data show the payment restart has produced a new wave of borrowers falling into default.
After a three-year pandemic payment pause and a one-year “on ramp” that temporarily shielded borrowers from the harshest consequences of missed payments, scheduled payments became mandatory again in late 2024. By mid-2025, borrowers who never resumed payment began to slip into default. Many more joined them in the months that followed.
AP’s analysis of Office of Federal Student Aid data finds that, following the pause, the group of defaulted borrowers grew by 4.2 million by March 2026, pushing the national total to about 9.5 million borrowers. That’s above the pre-pandemic peak of 8 million in December 2019. Default occurs after borrowers miss payments for an extended period, making them subject to penalties such as wage garnishment.
Hundreds of thousands more are months behind on payments, and another surge in defaults could be on the way.
Millions of borrowers are facing higher monthly payments as the government dismantles its most affordable income-driven repayment option, the SAVE plan, one of several changes the Education Department says are intended to simplify a fragmented system.
The AP tracked loan data produced by the Office of Federal Student Aid and formatted it for use in state-level reporting on these topics. Here is an overview of our data analysis and tips on using it in local reporting.
This guide features publishable lines for states that stand out in our data: Alabama, Alaska, Arizona, Arkansas, Colorado, Connecticut, Delaware, Florida, Georgia, Indiana, Louisiana, Maryland, Mississippi, Nevada, New Hampshire, New Mexico, North Carolina, Oklahoma, Puerto Rico, South Carolina, Texas, U.S. Virgin Islands, Washington, D.C.
READ AP'S COVERAGE
As defaults on student loans surge, millions are trying to get their lives back on track
A wave of student loan borrowers have entered default since pandemic-era protections lapsed
DATA INCLUDED IN THE ANALYSIS
The data is sourced from the Office of Federal Student Aid (FSA). The FSA updates its Federal Student Loan Portfolio dataset quarterly. The AP has curated and analyzed defaulted borrower numbers, as well as non-payment rates by school, for state-level reporting:
— Our defaults data includes the number of borrowers and their balances, representing all federally managed loans that are delinquent by more than 270 days. At the state level, defaulted loans are defined as delinquent by more than 360 days. For more information on why the default timing differs at the state level, visit the README in the AP's curated dataset.
— Nonpayment rates pertain to borrowers with direct federal loans that entered repayment status between January 2020 and May 2025. The rate reflects the percentage of those borrowers who were more than 90 days late on payments by the end of May this year, including those in default.
FIND THE DATA TO TELL THE STORY IN YOUR STATE
Here is a link to the AP’s curated data. AP has compiled the most useful state-level data into four spreadsheets:
DEFAULT DATA
— Total defaulted borrower counts and outstanding balances by quarter through March 2026.
— State-level defaulted borrower counts and outstanding balances at the end of March 2026.
NONPAYMENT
— Nonpayment rates by school with data through May 2026.
— State-level nonpayment rates with data through May 2026.
KEY TAKEAWAYS: DEFAULTS
State-level defaults data reflect borrowers’ current state of residence. Use these data to report how many borrowers in your state are in default and how much they owe. High default rates can affect local economies because such borrowers often have low credit scores and may face federal collection efforts such as wage garnishment.
— The group of borrowers in default — more than 270 days late on payments — has grown by 4.2 million since the pandemic payment pause ended.
— The majority of borrowers in default are more than 360 days late on payments. From the end of the payment pause to March this year, this group of borrowers alone had grown by about 3.7 million. This surge was largest in Mississippi, Louisiana, Alabama, Puerto Rico, Texas, Nevada, Indiana, Delaware, Ohio and Arizona. In each of those states, the local increase represented at least 10% of borrowers. Here are publishable lines for the states:
Since the pandemic pause ended, the number of borrowers living in Louisiana who are more than 360 days delinquent has grown by 92,000, bringing the total to 187,000, or 27% of residents with loans.
Since the pandemic pause ended, the number of borrowers living in Mississippi who are more than 360 days delinquent has grown by 57,000, bringing the total to 129,000, or 28% of residents with loans.
Since the pandemic pause ended, the number of borrowers living in Alabama who are more than 360 days delinquent has grown by 77,000, bringing the total to 169,000, or 25% of residents with loans.
Since the pandemic pause ended, the number of borrowers living in Puerto Rico who are more than 360 days delinquent has grown by 39,000, bringing the total to 104,000, or 31% of residents with loans.
Since the pandemic pause ended, the number of borrowers living in Georgia who are more than 360 days delinquent has grown by 191,000, bringing the total to 396,000, or 23% of residents with loans.
Since the pandemic pause ended, the number of borrowers living in South Carolina who are more than 360 days delinquent has grown by 86,000, bringing the total to 182,000, or 23% of residents with loans.
Since the pandemic pause ended, the number of borrowers living in North Carolina who are more than 360 days delinquent has grown by 146,000, bringing the total to 296,000, or 21% of residents with loans.
Since the pandemic pause ended, the number of borrowers living in Texas who are more than 360 days delinquent has grown by 417,000, bringing the total to 878,000, or 22% of residents with loans.
Since the pandemic pause ended, the number of borrowers living in Nevada who are more than 360 days delinquent has grown by 38,000, bringing the total to 93,000, or 25% of residents with loans.
Since the pandemic pause ended, the number of borrowers living in Arizona who are more than 360 days delinquent has grown by 94,000, bringing the total to 232,000, or 25% of residents with loans.
Since the pandemic pause ended, the number of borrowers living in Delaware who are more than 360 days delinquent has grown by 14,000, bringing the total to 29,000, or 21% of residents with loans.
Since the pandemic pause ended, the number of borrowers living in Indiana who are more than 360 days delinquent has grown by 90,000, bringing the total to 212,000, or 24% of residents with loans.
KEY TAKEAWAYS: NONPAYMENT RATES
Nonpayment rates measure where borrowers attended school, not necessarily where they currently live. The Education Department considers high nonpayment rates an early warning sign that schools may develop higher default rates. Use the aggregate state-level data to compare nonpayment rates across all schools or by sector — public, private nonprofit and for-profit — and the institution-level data to identify the colleges driving trends in your state.
— At least 1 in 5 borrowers were 90 or more days late on payments in 14 states, the U.S. Virgin Islands and Puerto Rico:
Among schools in Alaska, about 5,400 borrowers — about 27% — were late on payments.
Among schools in Louisiana, about 83,300 borrowers — about 26% — were late on payments.
Among schools in the U.S. Virgin Islands, about 300 borrowers — about 26% — were late on payments.
Among schools in Connecticut, about 62,100 borrowers — about 25% — were late on payments.
Among schools in Puerto Rico, about 38,200 borrowers — about 24% — were late on payments.
Among schools in Arizona, about 205,200 borrowers — about 24% — were late on payments.
Among schools in Florida, about 222,100 borrowers — about 23% — were late on payments.
Among schools in Oklahoma, about 45,100 borrowers — about 23% — were late on payments.
Among schools in Washington D.C., about 41,400 borrowers — about 23% — were late on payments.
Among schools in Texas, about 275,900 borrowers — about 22% — were late on payments.
Among schools in New Hampshire, about 65,800 borrowers — about 22% — were late on payments.
Among schools in Colorado, about 77,900 borrowers — about 22% — were late on payments.
Among schools in Mississippi, about 33,900 borrowers — about 21% — were late on payments.
Among schools in Arkansas, about 33,300 borrowers — about 21% — were late on payments.
Among schools in Georgia, about 105,400 borrowers — about 21% — were late on payments.
Among schools in New Mexico, about 10,900 borrowers — about 20% — were late on payments.
— Borrowers who attended for-profit schools were the most likely to miss their scheduled payments. At for-profit schools, about 1 in 3 borrowers were behind on payments compared to about 1 in 6 at public colleges.
— Among for-profit schools, non-payment rates are largest in Oklahoma, Maryland, Connecticut, North Carolina and Louisiana. In each of those states, at least 40% of borrowers who attended for-profit schools were late on their payments:
About 13,100 borrowers who attended for-profit schools in Oklahoma — 48% — were late on payments.
About 14,200 borrowers who attended for-profit schools in Maryland — 45% — were late on payments.
About 44,900 borrowers who attended for-profit schools in Connecticut — 43% — were late on payments.
About 7,700 borrowers who attended for-profit schools in North Carolina — 42% — were late on payments.
About 23,200 borrowers who attended for-profit schools in Louisiana — 41% — were late on payments.
— While nonpayment rates tend to be lower at public colleges, they enroll many more borrowers. As a result, these borrowers make up a larger proportion of borrowers behind on payments. Around 45% of nonpaying borrowers attended public schools compared to 31% at for-profit schools.
— Among public colleges, non-payment rates are largest in the U.S. Virgin Islands, Louisiana, Washington D.C., Mississippi and Arkansas. In each of those states, at least 20% of borrowers who attended public colleges were late on their payments:
About 300 borrowers who attended public schools in the U.S. Virgin Islands — 26% — were late on payments.
About 55,200 borrowers who attended public schools in Louisiana — 24% — were late on payments.
About 700 borrowers who attended public schools in Washington D.C. — 24% — were late on payments.
About 28,800 borrowers who attended public schools in Mississippi — 22% — were late on payments.
About 26,100 borrowers who attended public schools in Arkansas — 20% — were late on payments.
— Among private colleges, non-payment rates are largest in West Virginia, South Carolina, Alabama, New Hampshire, Florida, Arizona and Arkansas. In each of those states, at least 20% of borrowers who attended private schools were late on their payments:
About 4,300 borrowers who attended private schools in West Virginia — 27% — were late on payments.
About 12,000 borrowers who attended private schools in South Carolina — 24% — were late on payments.
About 8,800 borrowers who attended private schools in Alabama — 24% — were late on payments.
About 60,100 borrowers who attended private schools in New Hampshire — 23% — were late on payments.
About 73,900 borrowers who attended private schools in Florida — 22% — were late on payments.
About 43,900 borrowers who attended private schools in Arizona — 21% — were late on payments.
About 4,200 borrowers who attended private schools in Arkansas — 20% — were late on payments.
CONSIDER THESE REPORTING THREADS
— Talk with students in your communities who have defaulted on student loans. Were they in a plan that was recently discontinued? How did they fare when payments resumed? What kinds of financial challenges have they faced? Are they older, with retirement looming? Are they trying to raise small children while paying off loans? Are the loans stopping them from saving for a house or making other purchases?
— Investigate what types of people are most likely to have entered default in recent months.
— Check on the default rates of trade schools, community colleges, public universities and for-profit schools in your areas; compare different types of institutions. Do certain institutions stand out? Why are the rates higher at some schools versus others? Why are borrowers from certain colleges struggling more than those from peer institutions? Investigate schools with unusually high nonpayment rates.
— Ask schools what they’re doing to keep borrowers out of default. Do they provide financial counseling, repayment guidance or outreach to former students? Have those efforts changed since payments resumed?
— Reach out to elected officials in your state and ask about the issue. What do they think should be changed? Are there any innovative solutions in your state to address these trends?
— Examine the local economic impact. What do business leaders, employers, consumer advocates and economists say? Are they worried that student loan repayment could be a drag on the economy? Are workers delaying career changes, additional education or relocation because of repayment obligations?
READ ADDITIONAL AP COVERAGE
Changes to student loans are taking effect July 1. Here’s what to know
The Trump administration says it is cutting student loan interest. Here are some facts and context
Nursing gains ‘professional’ label for student loans after judge’s ruling, but theology now dropped
Judges strike down Trump administration’s overhaul of student loan forgiveness program
Money Happens: Tips for dealing with student loan debt when it affects your mental health
Dropped out? Colleges are helping students reenroll to finish degrees
The Associated Press’ education coverage receives financial support from multiple private foundations. AP is solely responsible for all content. Find AP’s standards for working with philanthropies, a list of supporters and funded coverage areas at AP.org.
Localize It is a resource produced regularly by The Associated Press for its customers’ use. Questions can be directed to the Local News Success team at localizeit@ap.org. View guides published in the last 30 days here.
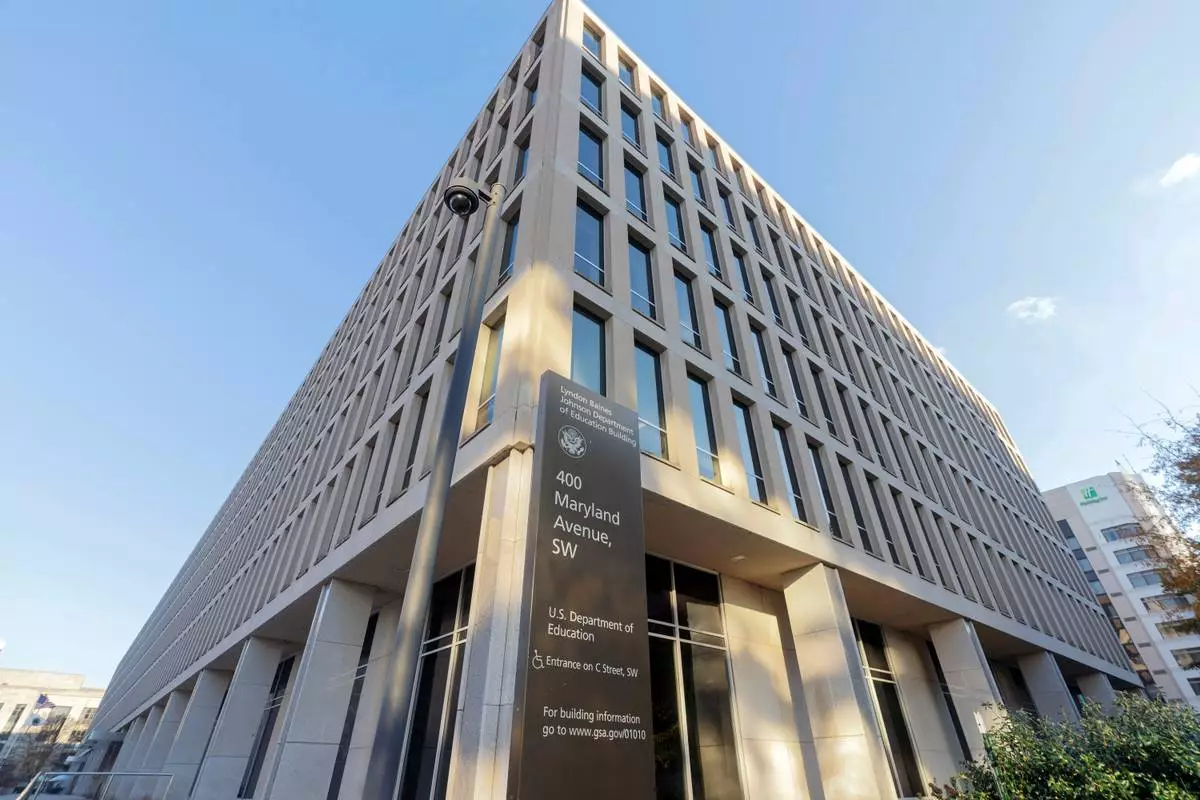
FILE - The U.S. Department of Education building is photographed in Washington, Dec. 3, 2024. (AP Photo/Jose Luis Magana, File)
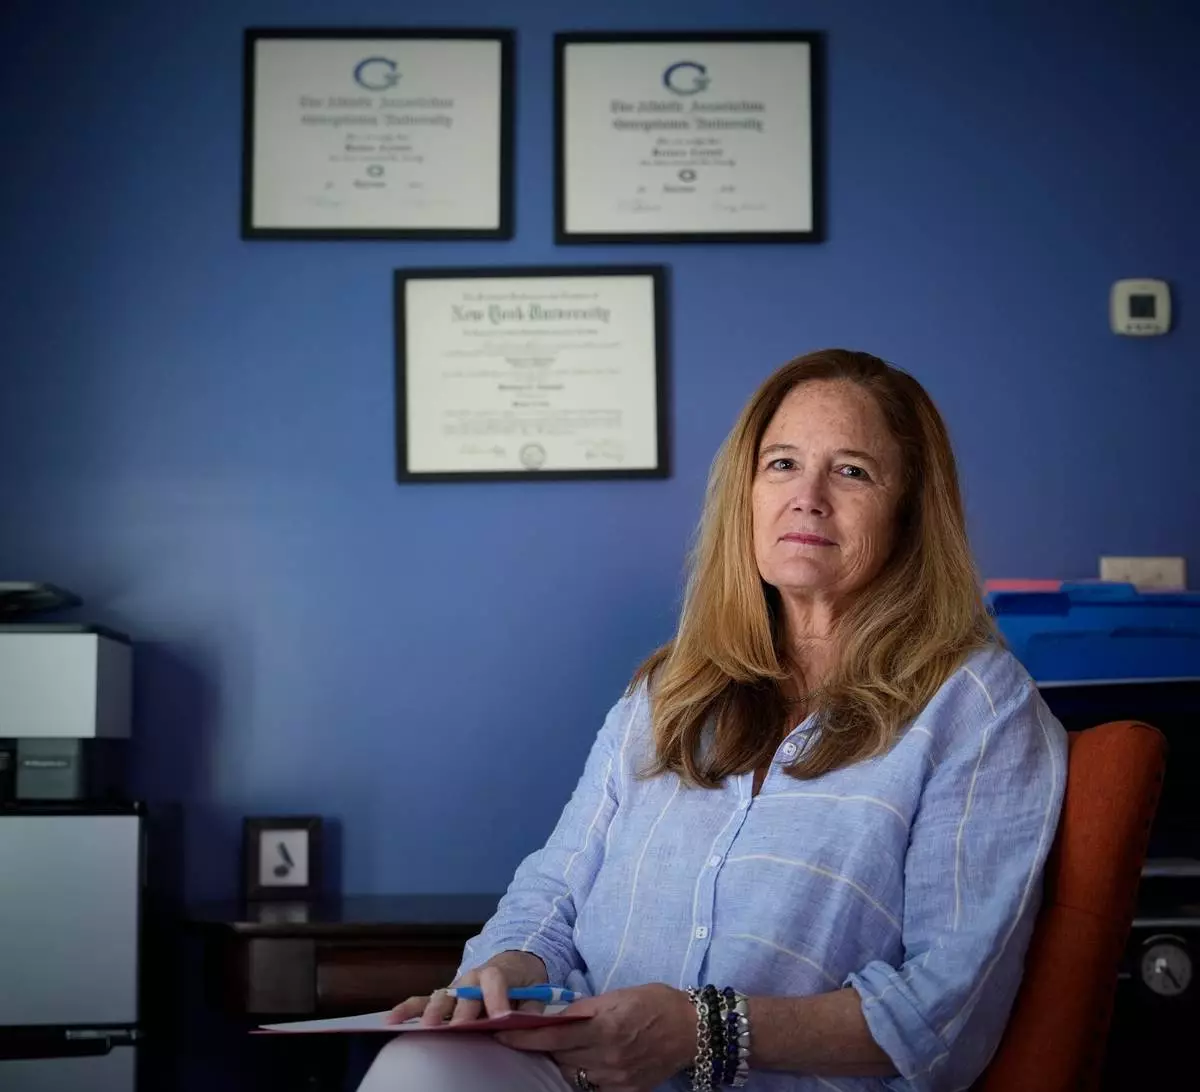
Barbara Howaniec, a psychiatric nurse practitioner, poses for a photo in her office on Monday, June 15, 2026, in Portland, Maine. (AP Photo/Robert F. Bukaty)