Provisional statistics of restaurant receipts and purchases for second quarter of 2026
The Census and Statistics Department (C&SD) released the latest provisional figures on restaurant receipts and purchases today (August 4).
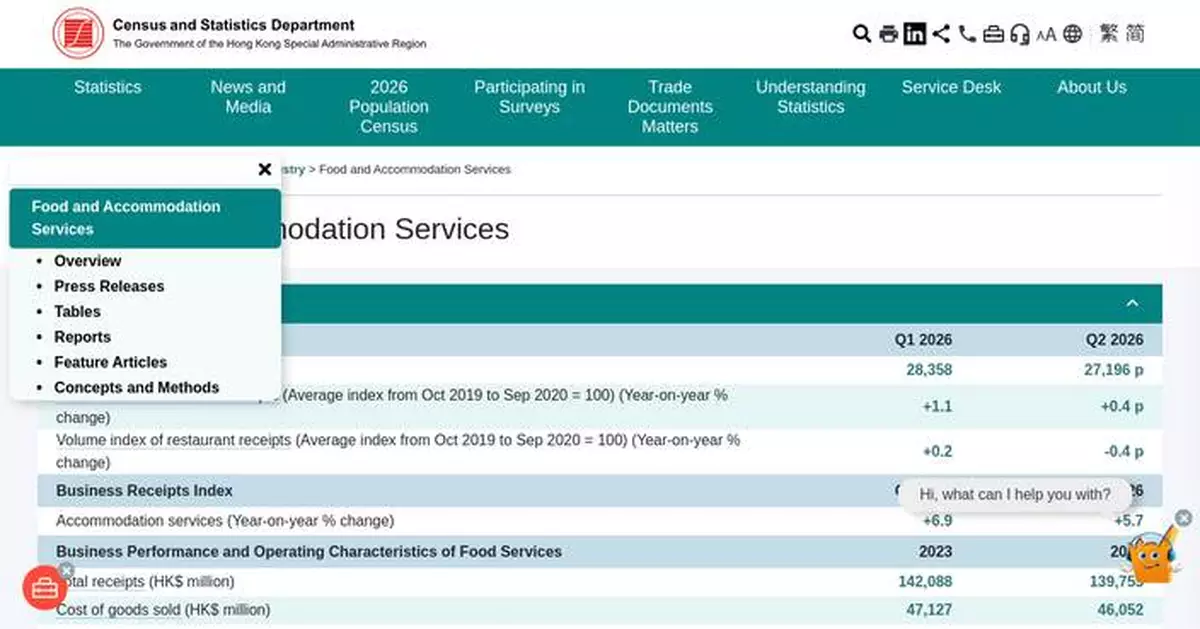
The value of total receipts of the restaurants sector in the second quarter of 2026, provisionally estimated at $27.2 billion, increased by 0.4% over a year earlier. Over the same period, the provisional estimate of the value of total purchases by restaurants increased by 2.5% to $8.8 billion.
After netting out the effect of price changes over the same period, the provisional estimate of the volume of total restaurant receipts decreased by 0.4% in the second quarter of 2026 compared with a year earlier.
Analysed by type of restaurant and comparing the second quarter of 2026 with the second quarter of 2025, total receipts of Chinese restaurants increased by 1.5% in value and 0.7% in volume. Total receipts of non-Chinese restaurants increased by 1.6% in value and 1.0% in volume. Total receipts of fast food shops decreased by 1.5% in value and 2.5% in volume. Total receipts of bars decreased by 3.8% in value and 4.6% in volume. As for miscellaneous eating and drinking places, total receipts decreased by 2.7% in value and 3.6% in volume.
Based on the seasonally adjusted series, the provisional estimate of total restaurant receipts decreased by 0.5% in both value and volume in the second quarter of 2026 compared with the preceding quarter.
Comparing the first half of 2026 with the same period in 2025, total restaurant receipts increased by 0.8% in value but decreased by 0.1% in volume.
To facilitate further understanding of the short-term business performance of the restaurants sector, statistics in respect of the restaurant receipts and purchases in individual months of the reference quarter are also compiled.
Analysed by month, it was provisionally estimated that the value of total receipts of the restaurants sector increased by 0.9%, increased by 0.6% and decreased by 0.5% respectively in April, May and June 2026, compared with the corresponding months in 2025.
After discounting the effect of price changes, it was provisionally estimated that the volume of total restaurant receipts increased by 0.2%, decreased by 0.2% and decreased by 1.3% respectively in April, May and June 2026, compared with the corresponding months in 2025.
Commentary
A Government spokesman said that business of restaurants was largely steady recently. The value of total restaurant receipts increased by 0.4% in the second quarter over a year earlier, rendering an increase of 0.8% in the first half of the year.
Looking ahead, continued economic expansion, rising local incomes, and a steady increase in inbound visitors are expected to provide support to restaurant businesses. Yet, external uncertainties still constitute downside risks. The Government will continue to closely monitor the potential impacts of external developments on restaurant businesses.
Further information
Table 1 presents the revised figures of restaurant receipts by type of restaurant and total purchases by the restaurants sector for the first quarter of 2026 as well as the provisional figures for the second quarter of 2026.
Table 2 and Table 3 present the revised value and volume indices respectively of restaurant receipts by type of restaurant for the first quarter of 2026 and the provisional indices for the second quarter of 2026.
Table 4 presents the year-on-year rate of change in total restaurant receipts in value and volume terms based on the original quarterly series, as well as the quarter-to-quarter rate of change based on the seasonally adjusted series.
The revised figures on restaurant receipts and purchases for the second quarter of 2026 (with breakdown by month) will be released through the website of theC&SD (www.censtatd.gov.hk/en/scode540.html) and relevant publications of the Department from September 18, 2026.
The classification of restaurants follows the Hong Kong Standard Industrial Classification (HSIC) Version 2.0, which is used in various economic surveys for classifying economic units into different industry classes.
More detailed statistics are given in the "Report on Quarterly Survey of Restaurant Receipts and Purchases". Users can browse and download the publication at the website of the C&SD (www.censtatd.gov.hk/en/EIndexbySubject.html?pcode=B1080002&scode=540).
Users who have enquiries about the survey results may contact the Distribution Services Statistics Section of theC&SD (Tel: 3903 7401; e-mail: qsr@censtatd.gov.hk).
Source: AI-found images
Provisional Statistics of Retail Sales for June 2026
The Census and Statistics Department (C&SD) released the latest figures on retail sales today (August 4).
The value of total retail sales in June 2026, provisionally estimated at $31.5 billion, increased by 4.6% compared with the same month in 2025. The revised estimate of the value of total retail sales in May 2026 increased by 7.9% compared with a year earlier. For the first half of 2026, it was provisionally estimated that the value of total retail sales increased by 9.6% compared with the same period in 2025.
Of the total retail sales value in June 2026, online sales accounted for 9.4%. The value of online retail sales in that month, provisionally estimated at $3.0 billion, increased by 11.6% compared with the same month in 2025. The revised estimate of online retail sales in May 2026 increased by 32.4% compared with a year earlier. For the first half of 2026, it was provisionally estimated that the value of online retail sales increased by 27.7% compared with the same period in 2025.
After netting out the effect of price changes over the same period, the provisional estimate of the volume of total retail sales in June 2026 increased by 2.3% compared with a year earlier. The revised estimate of the volume of total retail sales in May 2026 increased by 4.8% compared with a year earlier. For the first half of 2026, the provisional estimate of the total retail sales increased by 7.2% in volume compared with the same period in 2025.
Analysed by broad type of retail outlet in descending order of the provisional estimate of the value of sales and comparing June 2026 with June 2025, the value of sales of jewellery, watches and clocks, and valuable gifts increased by 20.1%. This was followed by sales of other consumer goods not elsewhere classified (+9.3% in value); food, alcoholic drinks and tobacco (+2.5%); wearing apparel (+0.8%); medicines and cosmetics (+0.6%); electrical goods and other consumer durable goods not elsewhere classified (+11.3%); furniture and fixtures (+5.1%); books, newspapers, stationery and gifts (+2.6%); and optical shops (+2.1%).
On the other hand, the value of sales of commodities in supermarkets decreased by 1.1% in June 2026 over a year earlier. This was followed by sales of commodities in department stores (-4.2% in value); motor vehicles and parts (-4.3%); fuels (-15.3%); footwear, allied products and other clothing accessories (-1.4%); and Chinese drugs and herbs (-4.9%).
Based on the seasonally adjusted series, the provisional estimate of the value of total retail sales decreased by 3.0% in the second quarter of 2026 compared with the preceding quarter, while the provisional estimate of the volume of total retail sales decreased by 2.6%.
Commentary
A government spokesman said that the latest retail sales figures indicate that the sector remains on a positive trajectory. The value of total retail sales increased for the 14th consecutive month in June, recording a growth rate of 4.6%. Cumulatively, total retail sales value in the first half of the year was 9.6% higher than a year earlier.
Growth was broad-based across many retail categories. Continued economic expansion, rising local incomes, and a steady increase in inbound visitors are expected to provide support to the sector. Yet, external uncertainties constitute downside risk. The Government will continue to closely monitor the potential impacts of external developments on the local consumption market.
Further information
Table 1 presents the revised figures on value index and value of retail sales for all retail outlets and by broad type of retail outlet for May 2026 as well as the provisional figures for June 2026. The provisional figures on the value of retail sales for all retail outlets and by broad type of retail outlet as well as the corresponding year-on-year changes for the first half of 2026 are also shown.
Table 2 presents the revised figures on value of online retail sales for May 2026 as well as the provisional figures for June 2026. The provisional figures on year-on-year changes for the first half of 2026 are also shown.
Table 3 presents the revised figures on volume index of retail sales for all retail outlets and by broad type of retail outlet for May 2026 as well as the provisional figures for June 2026. The provisional figures on year-on-year changes for the first half of 2026 are also shown.
Table 4 shows the movements of the value and volume of total retail sales in terms of the year-on-year rate of change for a month compared with the same month in the preceding year based on the original series, and in terms of the rate of change for a three-month period compared with the preceding three-month period based on the seasonally adjusted series.
The classification of retail companies follows the Hong Kong Standard Industrial Classification (HSIC) Version 2.0, which is used in various economic surveys for classifying economic units into different industry classes.
These retail sales statistics measure the sales receipts in respect of goods sold by local retail companies and are primarily intended for gauging the short-term business performance of the local retail sector. Data on retail sales are collected from local retail companies through the Monthly Survey of Retail Sales (MRS). Local retail companies with and without physical shops are covered in MRS and their sales, both through conventional shops and online channels, are included in the retail sales statistics.
The retail sales statistics cover consumer spending on goods but not on services (such as those on housing, catering, medical care and health services, transport and communication, financial services, education and entertainment) which account for over 50% of the overall consumer spending. Moreover, they include spending on goods in Hong Kong by visitors but exclude spending outside Hong Kong by Hong Kong residents. Hence they should not be regarded as indicators for measuring overall consumer spending.
Users interested in the trend of overall consumer spending should refer to the data series of private consumption expenditure (PCE), which is a major component of the Gross Domestic Product published at quarterly intervals. Compiled from a wide range of data sources, PCE covers consumer spending on both goods (including goods purchased from all channels) and services by Hong Kong residents whether locally or abroad. Please refer to the C&SD publication “Gross Domestic Product by Expenditure Component” for more details.
More detailed statistics are given in the "Report on Monthly Survey of Retail Sales". Users can browse and download this publication at the website of the C&SD (www.censtatd.gov.hk/en/EIndexbySubject.html?pcode=B1080003&scode=530).
Users who have enquiries about the survey results may contact the Distribution Services Statistics Section of C&SD (Tel: 3903 7400; email: mrs@censtatd.gov.hk).
Source: AI-found images