BURBANK, Calif.--(BUSINESS WIRE)--Sep 18, 2026--
The Walt Disney Company (NYSE: DIS) today announced that Karandeep Anand will join the company as Senior Executive Vice President and Chief Technology Officer, a newly created position, effective October 2. Anand, who most recently has served as CEO of Character.AI, will report directly to Disney Chief Executive Officer Josh D'Amaro.
This press release features multimedia. View the full release here: https://www.businesswire.com/news/home/20260918458816/en/
“Karandeep brings a rare mix of experience across infrastructure, consumer technology and AI, and will be a vital addition to Disney’s senior leadership team as we further our three priorities: great storytelling as our North Star, technology in service of creativity, and operating as One Disney," said D'Amaro. “He is an expert builder and strategist, technical and product-minded, with sharp instincts for what fans actually want. He also has real enthusiasm and respect for Disney, a clear sense of where technology and creativity meet, and shares our belief that technology creates the most value when it helps people do their best work.”
As Chief Technology Officer, Anand will oversee enterprise technology, infrastructure, data and AI platforms, product, and engineering, working across the company's segment technology teams to further modernize how Disney builds and delivers technology company-wide. Along with Anand’s appointment, a number of Character.AI’s technical team are expected to join Disney. The move comes as D’Amaro is sharpening Disney’s focus on technology as a driver of growth across the company. Since becoming CEO, D'Amaro has emphasized deepening Disney's direct relationships with fans by creating a more connected Disney experience, with Disney+ as the digital centerpiece.
“I’ve admired Disney my entire life for how it blends unforgettable storytelling with the latest technology to constantly push the boundaries of what entertainment can be," Anand said. “I’m honored to join a team with such extraordinary creative talent, and I look forward to building on the company’s impressive technology capabilities to help Disney connect fans worldwide with its beloved stories and characters in new and innovative ways.”
Anand led Character.AI through a period of explosive growth, building one of the most engaged consumer-AI audiences in the world, while also making user trust and safety a priority as the platform scaled. Before Character.AI, he was President and Chief Product Officer of the financial technology company Brex. He also served in several leadership roles at Meta’s Facebook, most recently as Vice President of Ads & Business Products. Earlier in his career, Anand held senior product and engineering leadership roles at Microsoft, where he worked for 15 years and was part of the team that built the Azure platform. He holds a Computer Science degree from the International Institute of Information Technology, Hyderabad.
About The Walt Disney Company
The Walt Disney Company, together with its subsidiaries and affiliates, is a leading diversified international entertainment and media enterprise that includes three business segments: Entertainment, Sports, and Experiences.

Karandeep Anand, The Walt Disney Company
EDITORS/NEWS DIRECTORS:
An analysis of government data by The Associated Press shows that an unprecedented surge in border crossings over the last decade has made immigrants an even bigger part of longtime magnets like New York and Miami and quickly transformed smaller cities with less developed immigrant footholds.
AP's analysis shows that while Florida was the most popular state, migrants increasingly chose cities elsewhere that promised better job prospects and quality of life.
Border crossings rose during President Donald Trump’s first term and soared under his successor, Joe Biden, bringing the U.S. immigrant population to its highest levels ever. Millions were released in the United States with notices to appear in immigration court or report to authorities, typically to argue for asylum. Crossings plummeted under severe asylum restrictions in June 2024 and fell to their lowest levels in six decades when Trump suspended asylum at the border.
AP obtained records on the self-reported destinations of 4.5 million migrants released in the United States after crossing the Mexican border between October 2018 and September 2025.
Some probably never arrived at the addresses they gave, though they have to report truthfully to pursue their cases in court and get work permits. Many moved elsewhere in the United States or left the country, voluntarily or involuntarily.
Despite those caveats, many stayed put and reshaped their adopted cities. This helped propel Trump to a second term, and the consequences are still playing out.
The initial shock that overwhelmed shelters and challenged schools faded. Like generations of immigrants before them, those who stayed have filled lower-wage jobs in construction and at restaurants and started businesses. Many live in constant fear of deportation.
This guide walks you through how to use the data AP obtained and ideas for making use of it in your reporting.
READ AP'S COVERAGE:
View the full interactive project here
A border surge reshaped America. Now, data shows who 4.5 million migrants were and where they went
How AP obtained and analyzed data on 4.5 million migrants released in the US at the border
Many Venezuelan immigrants shun Florida and turn to smaller cities in Utah, elsewhere
African asylum seekers find home in unlikely new American melting pots
PHOTO ESSAY: A small town on Cincinnati’s outskirts is among those transformed by immigration surge
Read some of our partner coverage at the end of the guide.
EXPLORE THE MAP
This interactive map shows where millions of migrants moved after crossing the Mexico-U.S. border from October 2018 to July 2025, according to their self-reported destinations. (Find an embeddable version of this map at the end of the guide and instructions for pinpointing a specific location when publishing.)
VIEW DATA BROKEN OUT BY STATE
For your reference within your newsrooms, AP has compiled an analysis of the migration data from U.S. Customs and Border Protection for each state. This allows you to explore, search and download tables with summary totals by ZIP code within that state — both for the overall migrant populations and country-specific totals by ZIP.
These state profiles can be viewed here, along with the methodology (which includes important caveats, wording recommendations and standards and ethics regarding privacy).
You can also view national state rankings, which include tables with total and per-capita numbers of migrants and migrants by citizenship and state.
The data includes destination ZIP codes recorded by CBP from October 2018 through early July 2025.
AP chose to apply a cutoff and did not report on individual ZIPs with less than 10 migrants for privacy reasons, either in total or in combination with other variables such as country. Therefore, ZIP totals with fewer than 10 migrants will not appear in the aggregate tables provided. The statewide totals of overall migrants do include such small-number ZIPs in their counts; therefore, the statewide total table provided will generally be a larger number than if you try to sum up all the ZIP entries from that state.
Using the tables in the state profiles for these two examples in California and Maryland, here's what you could say about the ZIPs and questions you might want to consider:
Example for Hyattsville, Maryland, ZIP 20783:
In Hyattsville’s 20783 ZIP code, CBP records reviewed by AP list 5,142 migrants with that ZIP as their reported onward destination. The ZIP’s profile is heavily Central American: 4,022 migrants, or 78.2% of the total, were recorded with Central American citizenships. The largest groups were Guatemalans, Salvadorans, Hondurans and Nicaraguans. South American citizenships accounted for another 810 migrants.
Questions for you to consider:
— Does the citizenship mix match what local schools, clinics, churches and legal-service groups are seeing?
— Are local groups serving different needs among Central American, South American and Haitian arrivals?
— Do organizations that work with these groups see Hyattsville as a first destination, a sponsor address, a transit point, or one part of a wider Washington-area network?
Example for Fresno, California, ZIP 93722:
CBP records reviewed by AP list the Fresno ZIP code 93722 as the reported destination for 4,350 migrants, with an unusually concentrated citizenship. Indian migrants accounted for 4,048, or 93%, of the total.
Questions for you to consider:
— Do Punjabi, South Asian, Sikh, legal-service or farmworker organizations recognize this area as a place Indian migrants seek to travel?
— Has a strong Indian community emerged in Fresno?
— Are there specific neighborhoods, employers, sponsor networks or housing arrangements that could explain the destination records?
PUBLISHABLE SENTENCES
Here are some publishable sentences from the above analysis that reference California, Florida, Illinois, Massachusetts, New York and Texas.
— Florida was the most common recorded destination state according to data obtained and analyzed by The Associated Press, with about 766,000 migrants, followed by Texas with about 625,000, California with about 476,000 and New York with about 444,000.
— Venezuelans were the largest citizenship group, AP's data shows, with about 773,000 recorded migrants, followed by Cubans with about 539,000 and Mexicans with about 404,000.
— Among records for Venezuelan migrants, Texas was the leading recorded destination state, with about 180,000 migrants, followed by Florida with about 124,000, Illinois with about 64,000 and New York with about 58,000.
— In Framingham, Massachusetts, the CBP records list about 7,100 migrants with recorded destination ZIPs there, with about 5,600 of those citizens of Brazil.
— Odessa, Texas, appears as a notable non-Florida destination for Cuban migrants, with CBP data listing about 6,500 Cuban migrants with destination ZIPs tied to the city.
CONSIDER THESE ANGLES WHEN VIEWING THE DATA
— Unexpected destination communities: Look for places outside the usual gateway cities where one citizenship group appears unusually concentrated. Some examples worth exploring locally include Haitians in Indianapolis and Springfield, Ohio; Indians in Fresno, California; Brazilians in Framingham, Massachusetts; Cubans in Louisville, Kentucky, or Odessa, Texas; and Mauritanians in Cincinnati. These are a handful of examples that we've highlighted. Are there ZIP codes in your state that are drawing certain groups?
— Communities with high migrant numbers relative to their populations: Focus on communities where the recorded destination count is large relative to local population, schools, housing stock, legal services or nonprofit capacity. The best stories may not be the biggest raw totals, but places where the numbers are unusually large for the size of the community.
— Country-specific destination networks: Rather than writing only about total migration, examine why particular nationalities cluster in particular places. Reporters could look into whether patterns reflect family networks, employers, churches, ethnic businesses, legal-service providers, sponsors or repeated use of a small number of mailing addresses.
— Typical destinations versus less-developed footholds: Florida, Texas, California, New York and New Jersey remain major recorded destinations, but the data also points to less obvious locations. The major destinations remained important while migrants also went to other, often smaller, locales. For example, AP found in our reporting that Utah — known as a relatively immigrant-friendly state despite deep Republican roots and support for President Donald Trump — became a top destination for Venezuelans crossing the border, along with parts of the Chicago, Denver, Atlanta, Dallas and Houston metro areas. Venezuelans also went to smaller cities including Madison, Wisconsin; Albuquerque, New Mexico; and Savannah, Georgia.
— Per-capita findings: Raw totals favor large states and cities. Per-capita ZIP or state rankings can surface smaller places where the recorded destination count was unusually high relative to population. These can be strong leads, but make sure to review the explanation of ZIP limitations in the methodology regarding per-capita findings.
CONSIDER THESE REPORTING THREADS
— Look at the data for your area. If ZIPs in your area are listed as a destination for a group or multiple groups, learn more about them. What has happened since then? Are they still around? Have they been deported? How are they faring in the community? How have they integrated? Talk to nonprofits and houses of worship serving these groups.
— It can be surprisingly straightforward to reach immigrants living in the U.S. legally or illegally. Most immigrant aid groups focus on these communities and understand the importance of media attention. The same is true for many immigration lawyers. If you hit a brick wall, try one of the big national groups — the National Immigrant Justice Center and Global Refuge, for example, are well-connected and have press offices — and ask for suggestions.
— Talk to migrants about their journey, how long they've been in the community, what they value about it, why they came and whether they intend to stay.
— Talk to community leaders who have a vantage point on how migrants are faring and integrating into the community and possible tension points. Talk to the mayor, business groups, the school superintendent, community clinics, hospitals, and police department or sheriff's office. Talk to food banks and nonprofits that work in the community. What have been the impacts of the increase in population, particularly in areas where the number of migrants is high in relation to the size of the area?
— How has your city adapted, or not, to serve and incorporate these populations? For example, if your city has had an influx of Indian migrants, are there Hindi interpreters or interpreter phone services for the police department, schools or hospitals? Have new businesses cropped up inspired by or serving these populations?
— If these groups have experienced targeted deportation efforts in the last couple of years, what have the impacts been on their community and the community at large? Talk to schools and religious institutions. Are families and children leaving home less frequently? Do schools have higher rates of absences? How have long-term residents responded to deportation efforts?
READ SOME OF OUR PARTNER COVERAGE
Hundreds of Haitian migrants named growing Alabama city as their destination: ‘People are just people’ from AL.com
90,667 migrants crossing southern border said they were headed to Maryland from The Baltimore Sun
After crossing the southern border, nearly 38,000 migrants said they were heading to Michigan from mlive.com
In Nashville, resources and resettlement services for immigrants and refugees are dwindling due to policy changes, funding cuts from Nashville Banner
Thousands of immigrants crossed the border bound for N.J. Here’s where they went. from NJ.com
Exclusive: Since 2018, thousands of migrants from southern border ID’d Staten Island as destination from silive.com
EMBED THIS MAP
This interactive map shows where millions of migrants went after crossing the Mexico-U.S. border from 2018-2025, according to their self-reported destination addresses. Readers can select ZIP codes to see the national origins of the migrants who reported they would move to each area or to explore wider trends using the search filter.
To focus on a particular area when the map loads, the embed URL can be augmented by adding a “pin” parameter along with the ZIP or larger area. For example:
— https://interactives.ap.org/border-migration-map-us/embed/?pin=83442
— https://interactives.ap.org/border-migration-map-us/embed/?pin=Texas
This map is current as of Sept. 16, 2026, and will not update. Source: AP Freedom of Information Act request with U.S. Customs and Border Protection.
Click for a preview.
To embed, insert this code into your CMS:
!-- start AP embed --
iframe src=“https://interactives.ap.org/border-migration-map-us/embed/” class=“ap-embed” width=“100%” frameborder=“0″ scrolling=“no” marginheight=“0″ /iframescript defer src=“https://interactives.ap.org/border-migration-map-us/resize-client.js” type=“text/javascript” /script
!-- end AP embed --
Localize It is a resource produced regularly by The Associated Press for its customers’ use. Questions can be directed to the Local News Success team at localizeit@ap.org. View guides published in the last 30 days here.
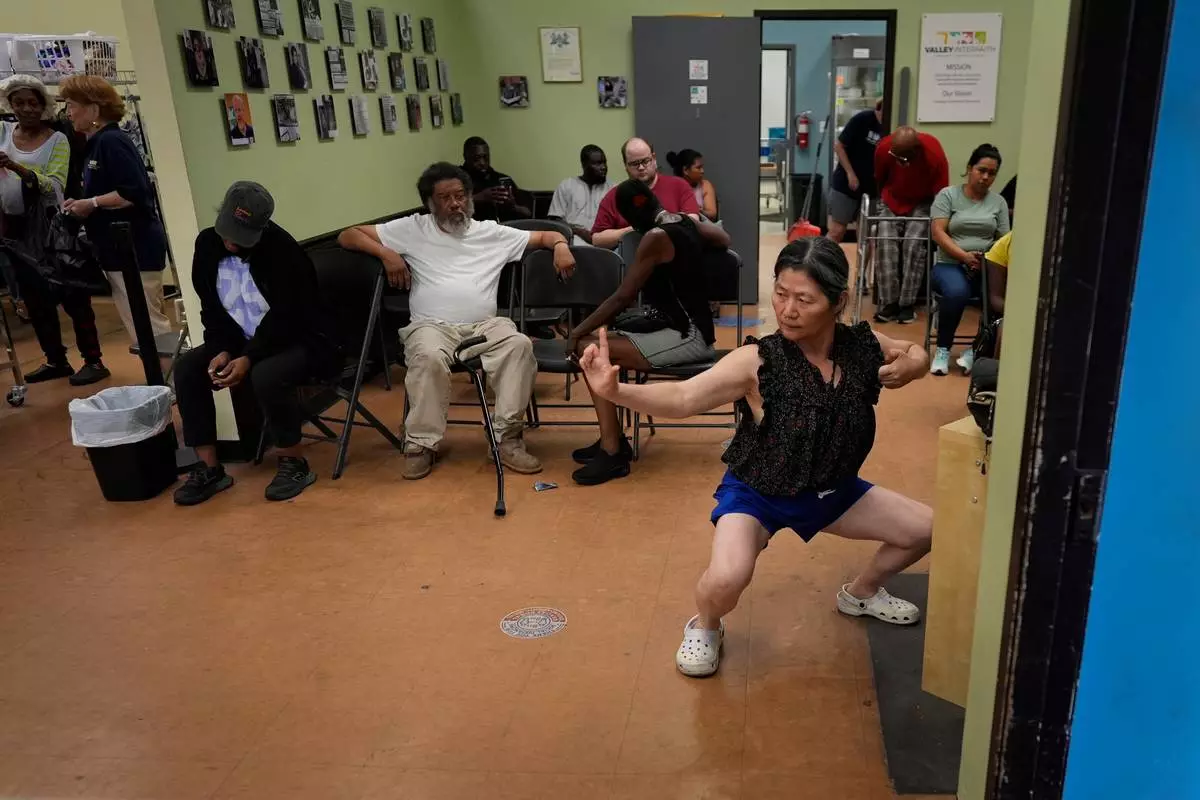
Yun Gao of China practices tai chi as she waits to receive food at Valley Interfaith Community Resource Center in Lockland, Ohio, Friday, July 10, 2026. (AP Photo/Carolyn Kaster)
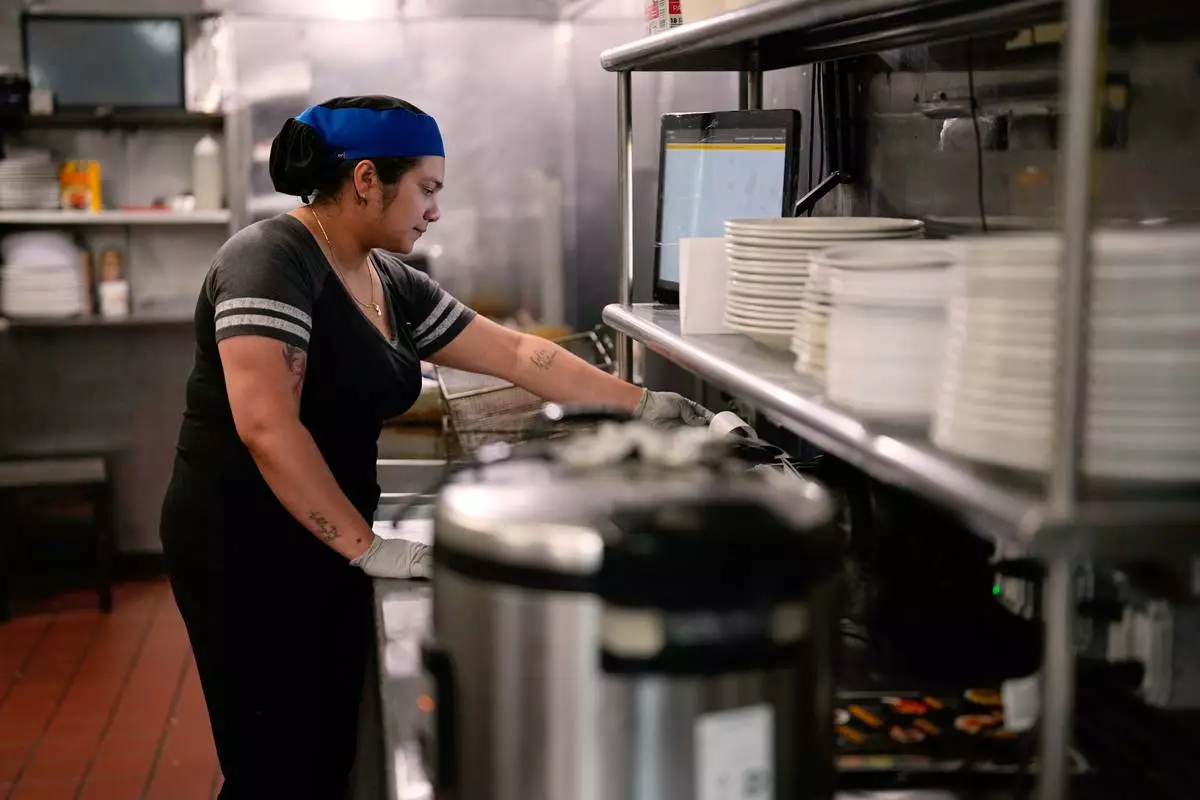
Dayana Ortega works at an Arempa's restaurant Tuesday, July 14, 2026, in Midvale, Utah. (AP Photo/Gregory Bull)
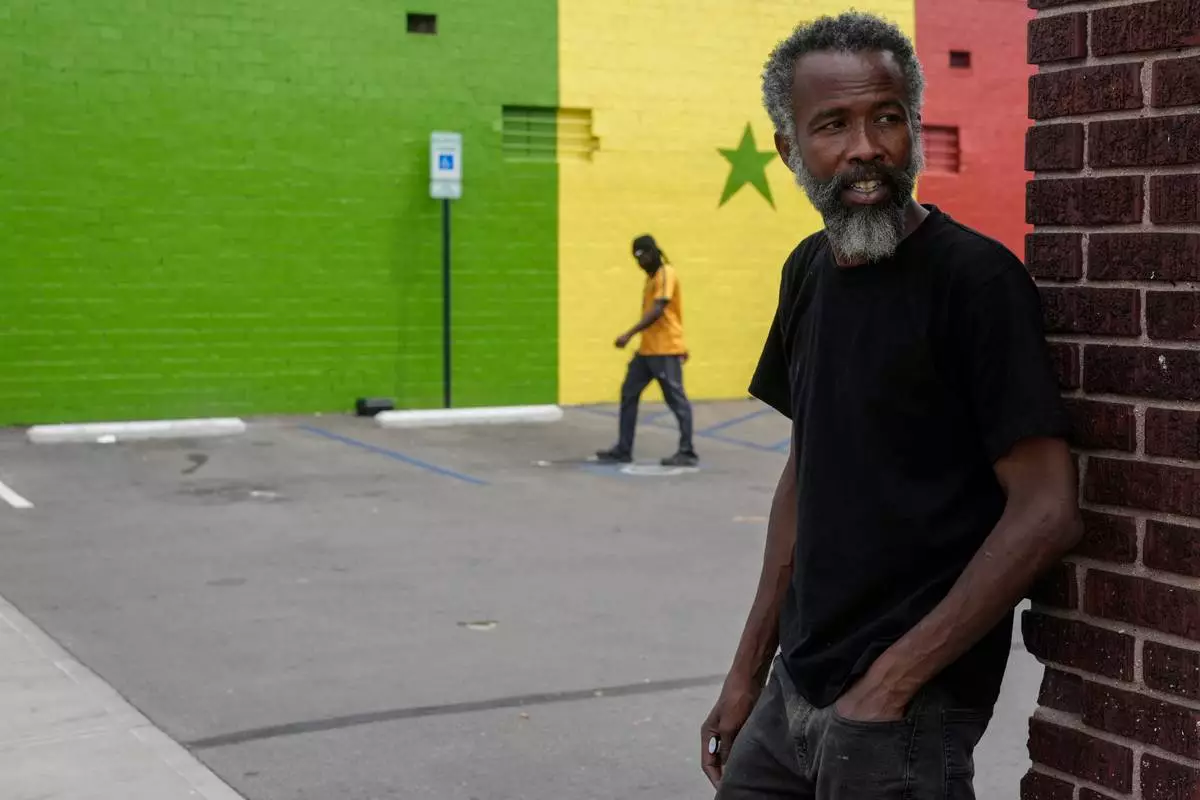
Moussa Sow, a Mauritanian immigrant, stands at the parking lot of Touba Tedoungal African restaurant in Lockland, Ohio, Friday, July 31, 2026. (AP Photo/Carolyn Kaster)

Barber Diego Contreras cuts the hair of fellow Venezuelan Diego Parra on Wednesday, July 15, 2026, in Midvale, Utah. (AP Photo/Gregory Bull)

Khalidou Sy, a Mauritanian immigrant, sits with his children in the family's home in Lockland, Ohio, Friday, July 31, 2026. Sy, a well-known hip-hop artist back home, had been jailed for his music critical of the country's repressive government. (AP Photo/Carolyn Kaster)