

SAN FRANCISCO--(BUSINESS WIRE)--Jul 29, 2026--
SoFi Technologies, Inc. (NASDAQ: SOFI), a member-centric, everything app for digital financial services that helps members borrow, save, spend, invest and protect their money, reported financial results today for its second quarter ended June 30, 2026.
This press release features multimedia. View the full release here: https://www.businesswire.com/news/home/20260729569583/en/
“2026 is shaping up to be a defining year, and our second quarter results mark a clear inflection point for SoFi,” said Anthony Noto, CEO of SoFi. “Despite continued market uncertainty, our business model continues to prove its durability. We grew members 35% year-over-year and added a record 2.2 million products, a 42% increase. For the first time, we added twice as many products as members, a major milestone that underscores the trust members place in SoFi and the power of our 'everything app'. Products like SoFi Plus and SoFi Coach are deepening member relationships and increasing lifetime value, while continued innovation across our consumer and enterprise platforms is expanding the value we deliver to members and clients.”
Consolidated Results Summary
Product Highlights
Consolidated Results
SoFi reported a number of record financial achievements. For the second quarter of 2026, record GAAP net revenue of $1.2 billion increased 43% relative to the prior-year period's $854.9 million. Record adjusted net revenue of $1.2 billion grew 40% from the corresponding prior-year period of $858.2 million.
For the second quarter of 2026, total fee-based revenue reached $472.3 million, representing 39% of total revenue in the quarter and increasing 22% from prior quarter. This was driven by strong contributions from origination fees, SoFi Tech Solutions revenue, strong performance from our Loan Platform Business, interchange revenue, and brokerage fee revenue. Together, the Financial Services and Technology Platform segments generated $550.8 million of net revenue, an increase of 17% from the prior year period.
Net interest income of $788.2 million for the second quarter was up 52% year-over-year. This was driven by a 49% increase in average interest-earning assets and a 36 basis point decrease in cost of funds, partially offset by a 32 basis point decrease in average asset yields year-over-year. For the second quarter, net interest margin of 5.98% increased 4 basis points from the prior quarter.
During the quarter, average total deposits comprised over 90% of average total liabilities. The average rate paid on deposits in the second quarter was 156 basis points lower than that paid on warehouse facilities, which translates to approximately $712.6 million of annualized interest expense savings due to the successful remixing of our funding base.
Second quarter record adjusted EBITDA of $357.8 million increased 44% from the prior year period's $249.1 million. This represents an adjusted EBITDA margin of 30%.
For the second quarter of 2026, GAAP net income reached $156.6 million and diluted earnings per share reached $0.12.
Equity grew by $264.6 million during the quarter to $11.1 billion and $8.58 of book value per share. Tangible book value grew by $225.8 million during the quarter, ending the period at $9.5 billion. Tangible book value per share was $7.34 at quarter-end, up from $4.72 per share in the prior year period, and up 56% year-over-year.
Member and Product Growth
Continued growth in both total members and products in the second quarter is the result of our continued investments in innovation and brand building and reflects the benefits of our broad product suite and unique Financial Services Productivity Loop (FSPL) strategy.
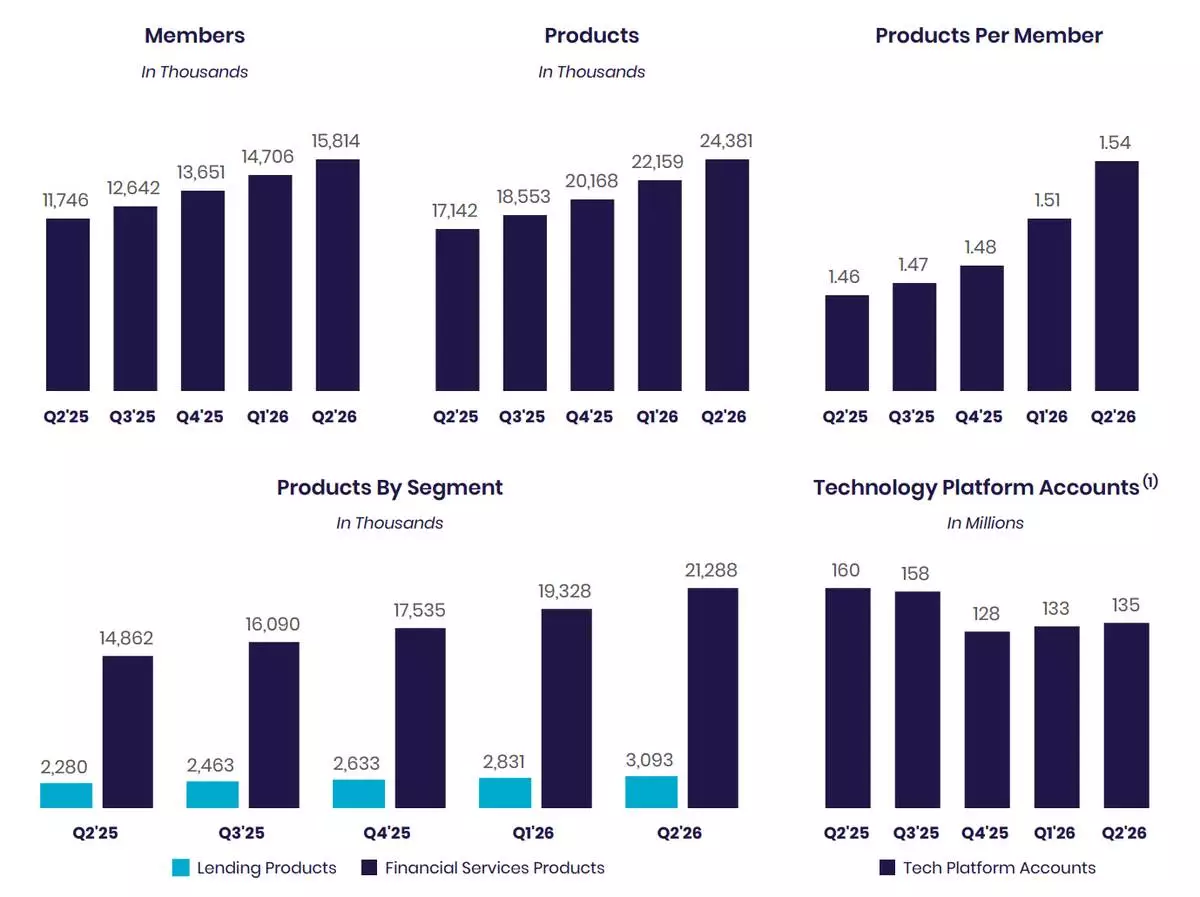
SoFi added a record 1.1 million members in the second quarter of 2026, bringing total members to 15.8 million, up 35% from 11.7 million at the end of the same prior year period.
SoFi also achieved record product additions of 2.2 million in the second quarter of 2026, bringing total products to nearly 24.4 million, up 42% from 17.1 million at the end of the same prior year period.
Financial Services products increased by 43% year-over-year to 21.3 million, primarily driven by continued demand for our SoFi Money, Relay and Invest products, and drove 89% of our total product growth. Financial Services products account for 87% of total products.
Lending products increased by 36% year-over-year to 3.1 million, driven by continued demand for personal, student, and home loan products.
Technology Platform-enabled accounts decreased 16% year-over-year to 135 million, including the impact from a large client which fully transitioned off the platform prior to December 31, 2025. Technology Platform-enabled accounts increased 2 million from the prior quarter.
Financial Services Segment Results
For the second quarter of 2026, Financial Services segment net revenue of $466.3 million increased 29% from the prior year period. Noninterest income of $217.2 million increased 28% year-over-year. Net interest income of $249.1 million increased 29% year-over-year, primarily driven by growth in consumer deposits.
In the second quarter, SoFi's Loan Platform Business added $143.3 million to our consolidated adjusted net revenue. Of this, $140.9 million was driven by $3.1 billion of personal loans originated on behalf of third parties as well as referrals to third parties. During the second quarter, SoFi expanded its Loan Platform Business offering to include SMB Loans while also reaching an agreement with a new partner to invest in personal loans. Subsequent to quarter-end, SoFi further expanded its LPB offering to include Home Equity Loans.
In addition to our Loan Platform Business, SoFi continued to see healthy growth in interchange fee revenue and brokerage fee revenue. In the second quarter, interchange fee revenue was up 55% year-over-year, as a result of $28 billion in total annualized spend in the quarter across SoFi Money and Credit Card. Brokerage fee revenue was up nearly 2.5x year-over-year, reflecting strong member demand and increased monetization.
Contribution profit for the second quarter of 2026 reached $212.7 million, a $24.4 million improvement over the prior year period, while contribution margin declined 6 percentage points year-over-year to 46%.
By continuously innovating with new and relevant offerings, features and rewards for members, SoFi grew total Financial Services products by 6.4 million, or 43%, year-over-year, bringing the total to 21.3 million at quarter-end. SoFi Money reached 7.9 million products, Relay reached 8.0 million products, SoFi Invest reached 3.9 million products, Crypto reached 388 thousand products and SoFi Plus reached 206 thousand products by the end of the second quarter.
In the second quarter of 2026, total deposits grew $5.3 billion to $45.5 billion, which included strong growth in member deposits.
Technology Platform Segment Results
Technology Platform segment net revenue of $84.5 million for the second quarter of 2026 increased 13% from the prior quarter. Compared to the prior year period, segment revenue decreased 23%. This includes the impact from a large client which fully transitioned off the platform prior to December 31, 2025. Contribution profit of $11.8 million reflected a contribution margin of 14%.
Technology Platform enabled accounts increased 2 million from the prior quarter. Technology Platform-enabled accounts decreased 16% year-over-year to 135 million.
During the second quarter, SoFi launched a new unified brand, SoFi Tech Solutions, offering enterprise clients products and services across one integrated platform serving four key areas: Processing, Banking Core Ledgers & Services, Payment Hub, and Risk & Fraud. SoFi also added new platform capabilities across credit cards, lines of credit, buy now, pay later, and installment lending.
Lending Segment Results
For the second quarter of 2026, Lending segment GAAP net revenue of $724.8 million increased 63% from the prior year period, while adjusted net revenue for the segment of $711.7 million increased 59% from the prior year period.
Lending segment performance in the second quarter was driven by net interest income, which rose 54% year-over-year. The balance of the growth was primarily driven from loan origination fees which increased 64% from the prior year.
Lending segment second quarter contribution profit of $399.0 million was up 63% from $244.7 million in the corresponding prior-year period. Lending segment adjusted contribution margin was strong at 56%. This strong performance reflects our ability to capitalize on continued strong demand for our lending products.
The following table summarizes the significant inputs to the fair value model for personal and student loans:
For the second quarter of 2026, record origination volume of $14.8 billion increased 69% year-over-year. This was a result of continued strong member demand for personal loans, student loans and home loans as well as strong demand from capital markets partners.
Record personal loan originations of $10.7 billion in the second quarter of 2026 were up 54% year-over-year, inclusive of $3.1 billion originated on behalf of third parties through our Loan Platform Business. SoFi's multichannel strategy continues to allow us to serve more members and provide revenue diversification.
Second quarter student loan volume of $2.7 billion was up 170% year-over-year. This marked the highest quarter of student loan originations in SoFi's history.
Home loan volume was $1.4 billion, an increase of 74% year-over-year. Home equity loan originations were strong during the second quarter, accounting for one-third of total home loan volume.
Capital markets activity in the second quarter of 2026 was strong. Overall, SoFi sold, or transferred through our Loan Platform Business, more than $4.1 billion in total of personal loans and home loans. In terms of home loan sales, we closed $833.7 million at a blended execution of 101.6%.
During the quarter, SoFi executed two co-contributor securitizations of loans previously originated through our Loan Platform Business, totaling $1.4 billion. These marked the sixth and seventh securitizations of new collateral under our SoFi Consumer Loan Program (SCLP) since 2021 using collateral originated in the Loan Platform Business. Importantly, this channel provides our partners with meaningful liquidity to support their ongoing investment in the Loan Platform Business. The transaction priced at industry-leading cost-of-funds levels, with a weighted average spread of 91 basis points and 86 basis points, respectively.
Credit performance for personal loans remained strong in the second quarter, in line with expectations. Excluding the impact of late stage delinquent loan sales, it is estimated that, including recoveries, the all-in annualized net charge-off rate for personal loans would have been approximately 3.7%, a 70 basis point improvement from the prior quarter and an 80 basis point improvement from the prior year period, driven by an improvement in the underlying performance as well as strong growth in average loans.
The personal loan annualized charge-off rate decreased 21 basis points year-over-year to 2.62%, which includes the impact of asset sales, new originations and delinquency sales in the quarter. The annualized charge-off rate decreased from 3.03% in the prior quarter. The student loan annualized charge-off rate decreased to 61 basis points from 65 basis points in the prior quarter.
The on-balance sheet 90-day delinquency rates for both personal loans and student loans were consistent with the prior year.
The data continues to support a 7–8% maximum cumulative net loss assumption for personal loans, in line with SoFi's underwriting tolerance.
Recent vintages, originated from the fourth quarter of 2022 to third quarter of 2025 have net cumulative losses of 4.68%, with 35% unpaid principal balance remaining. This is well below the 6.43% observed at the same point in time for the 2017 vintage which is the last vintage that approached our 7-8% tolerance. The gap between the newer cohort curve and the 2017 cohort curve improved by 15 basis points, after improving 9 basis points last quarter, demonstrating continued improvement.
Additionally, of the first quarter of 2020 through the first quarter of 2026 originations, 62% of principal has already been paid down, with 6.8% in net cumulative losses. Therefore, for life-of-loan losses on this entire cohort of loans to reach 8%, the charge-off rate on the remaining 38% of unpaid principal would need to be approximately 10%. This would be well above past levels, providing us further confidence in achieving loss rates below our 8% tolerance.
Guidance and Outlook
For the full year, management increases its revenue outlook. Management now expects to deliver adjusted net revenue of approximately $4.75 billion to $4.85 billion which implies approximately 32% to 35% annual adjusted net revenue growth year-over-year. Management continues to expect adjusted EBITDA of approximately $1.6 billion, which equates to an annual adjusted EBITDA margin of approximately 33% to 34%. Management also continues to expect adjusted net income of approximately $825 million, which equates to a margin of approximately 17%, and adjusted EPS of approximately 60 cents per share. This assumes an effective tax rate of approximately 22% for the full year 2026.
For 2026, management continues to expect to increase total members by at least 30% year-over-year.
Management will further address guidance on the quarterly earnings conference call. Management has not reconciled forward-looking non-GAAP measures to their most directly comparable GAAP measures. This is because the company cannot predict with reasonable certainty and without unreasonable efforts the ultimate outcome of certain GAAP components of such reconciliations due to market-related assumptions that are not within our control as well as certain legal or advisory costs, tax costs or other costs that may arise. For these reasons, management is unable to assess the probable significance of the unavailable information, which could materially impact the amount of the future directly comparable GAAP measures.
Earnings Webcast
SoFi’s executive management team will host a live audio webcast beginning at 8:00 a.m. Eastern Time (5:00 a.m. Pacific Time) today to discuss the quarter’s financial results and business highlights. All interested parties are invited to listen to the live webcast at https://investors.sofi.com. A replay of the webcast will be available on the SoFi Investor Relations website for 30 days. Investor information, including supplemental financial information, is available on SoFi’s Investor Relations website at https://investors.sofi.com.
Cautionary Statement Regarding Forward-Looking Statements
Certain of the statements above are forward-looking and as such are not historical facts. This includes, without limitation, statements regarding our expectations for the full year 2026 adjusted net revenue, annual growth rate, adjusted EBITDA, adjusted EBITDA margin, adjusted net income, adjusted EPS, and new members, our expectations regarding launching a unified brand across our technology platform businesses, our expectations regarding the revenue diversification benefits of our multichannel personal loan origination and sale strategy, our expectations regarding our ability to continue to grow our business, deliver superior financial returns, build our brand and launch new business lines and products, our ability to continue to drive momentum, deepen member engagement, and increase cross-buy, our expectations regarding the size of our market opportunity, our ability to continue to attract and execute deals, our ability to continue to improve our financials and increase our member, product and total accounts count, our ability to achieve diversified and more durable growth, including our ability to continue to grow our Loan Platform Business, our ability to continue the momentum seen in prior financial periods, our ability to have loss rates below 8%, our ability to navigate the macroeconomic, geopolitical and regulatory environment, any changes in demand for our products, and the financial position, business strategy and plans and objectives of management for our future operations. These forward-looking statements are not guarantees of performance. Such statements can be identified by the fact that they do not relate strictly to historical or current facts. Words such as “achieve”, “believe”, “continue”, “expect”, “capable”, “future”, “growth”, “may”, “opportunity”, “plan”, “potential”, “strategy”, “will be”, “will continue”, and similar expressions may identify forward-looking statements, but the absence of these words does not mean that a statement is not forward-looking. Factors that could cause actual results to differ materially from those contemplated by these forward-looking statements include: (i) the effect of and our ability to respond and adapt to changing market and economic conditions, including economic downturns, fluctuating inflation and interest rates, and volatility from macroeconomic, global, and political events, including announced or planned tariffs; (ii) our ability to maintain net income profitability, continue to increase fee-based revenue streams, continue to grow across our segments in the future, as well as our ability to meet our guidance; (iii) the impact on our business of the regulatory environment, changes in governmental policies, changes in personnel and resources of the governmental agencies that regulate us, and complexities with compliance related to such environment; (iv) our ability to realize the benefits of being a bank holding company and operating SoFi Bank, including continuing to grow high quality deposits and our rewards program for members; (v) our ability to continue to drive brand awareness and realize the benefits of our marketing and advertising campaigns; (vi) our ability to vertically integrate our businesses and accelerate the pace of innovation of our financial products; (vii) our ability to manage our growth effectively; (viii) our ability to access sources of capital on acceptable terms or at all; (ix) the success of our continued investments in our business; (x) our ability to expand our member base, increase our product adds and increase cross-buy; (xi) our ability to maintain our leadership position in certain categories of our business and to grow market share in existing markets or any new markets we may enter; (xii) our ability to cater to a broad range of clients and continue to execute deals with current or future business partners; (xiii) our ability to develop new products, features and functionality that are competitive and meet market needs; (xiv) our ability to realize the benefits of our strategy, including what we refer to as our FSPL; (xv) our ability to make accurate credit and pricing decisions or effectively forecast our loss rates; (xvi) our ability to establish and maintain an effective system of internal controls over financial reporting; (xvii) our ability to maintain the security and reliability of our products; and (xviii) the outcome of any legal or governmental proceedings instituted against us. The foregoing list of factors is not exhaustive. You should carefully consider the foregoing factors and the other risks and uncertainties set forth in the section titled “Risk Factors” in our last annual report on Form 10-K, as filed with the Securities and Exchange Commission, and those that are included in any of our future filings with the Securities and Exchange Commission. These forward-looking statements are based on information available as of the date hereof and current expectations, forecasts and assumptions, and involve a number of judgments, risks and uncertainties. Accordingly, forward-looking statements should not be relied upon as representing our views as of any subsequent date, and we do not undertake any obligation to update forward-looking statements to reflect events or circumstances after the date they were made, whether as a result of new information, future events or otherwise, except as may be required under applicable securities laws.
As a result of a number of known and unknown risks and uncertainties, our actual results or performance may be materially different from those expressed or implied by these forward-looking statements. You should not place undue reliance on these forward-looking statements.
Non-GAAP Financial Measures
This press release presents information about certain non-GAAP financial measures provided as supplements to the results provided in accordance with accounting principles generally accepted in the United States (GAAP). Our management and Board of Directors uses these non-GAAP measures to evaluate our operating performance, formulate business plans, help better assess our overall liquidity position, and make strategic decisions, including those relating to operating expenses and the allocation of internal resources. Accordingly, we believe that these non-GAAP measures provide useful information to investors and others in understanding and evaluating our operating results in the same manner as our management and Board of Directors. These non-GAAP measures have limitations as analytical tools, and should not be considered in isolation from, or as a substitute for, the analysis of other GAAP financial measures. Other companies may not use these non-GAAP measures or may use similar measures that are defined in a different manner. Therefore, SoFi's non-GAAP measures may not be directly comparable to similarly titled measures of other companies.
Reconciliations of these non-GAAP measures to the most directly comparable GAAP financial measures are provided in Table 2 to the “Financial Tables” herein.
About SoFi
SoFi Technologies (NASDAQ: SOFI) is the everything app for digital financial services on a mission to help people achieve financial independence to realize their ambitions. 15.8 million members trust SoFi to borrow, save, spend, invest, and protect their money and buy, sell and hold their crypto – all in one app – and get access to financial planners, exclusive experiences, and a thriving community. Banks, fintechs, and brands use innovative capabilities from SoFi Tech Solutions to serve over 134 million global accounts. For more information, visit www.sofi.com or download our iOS and Android apps.
Availability of Other Information About SoFi
Investors and others should note that we communicate with our investors and the public using our website ( https://www.sofi.com ), the investor relations website ( https://investors.sofi.com ), and on social media (X and LinkedIn), including but not limited to investor presentations and investor fact sheets, Securities and Exchange Commission filings, press releases, public conference calls and webcasts. The information that SoFi posts on these channels and websites could be deemed to be material information. As a result, SoFi encourages investors, the media, and others interested in SoFi to review the information that is posted on these channels, including the investor relations website, on a regular basis. This list of channels may be updated from time to time on SoFi’s investor relations website and may include additional social media channels. The contents of SoFi’s website or these channels, or any other website that may be accessed from its website or these channels, shall not be deemed incorporated by reference in any filing under the Securities Act of 1933, as amended.
SOFI-F
FINANCIAL TABLES
(Unaudited)
Table 2
Non-GAAP Financial Measures
(Unaudited)
Adjusted Net Revenue
Adjusted net revenue is a non-GAAP measure. Adjusted net revenue is defined as total net revenue, adjusted to exclude the fair value changes in servicing rights and residual interests classified as debt due to valuation inputs and assumptions changes, which relate only to our Lending segment, as well as gains and losses on extinguishment of debt. We adjust total net revenue to exclude these items, as they are non-cash charges that are not realized during the period or not indicative of our core operating performance, and therefore positive or negative changes do not impact the cash available to fund our operations. Management believes this measure is useful because it enables management and investors to assess our underlying operating performance and cash available to fund our operations. In addition, management uses this measure to better decide on the proper expenses to authorize for each of our operating segments, to ultimately help achieve target contribution profit margins.
The following table reconciles adjusted net revenue to total net revenue, the most directly comparable GAAP measure:
The following table reconciles adjusted net revenue for the Lending segment to total net revenue, the most directly comparable GAAP measure for the Lending segment:
Adjusted Noninterest Income
Adjusted noninterest income is a non-GAAP measure. Adjusted noninterest income is defined as noninterest income, adjusted to exclude the fair value changes in servicing rights and residual interests classified as debt due to valuation inputs and assumptions changes, which relate only to our Lending segment, as well as gains and losses on extinguishment of debt. We adjust noninterest income to exclude these items, as they are non-cash charges that are not realized during the period or not indicative of our core operating performance, and therefore positive or negative changes do not impact the cash available to fund our operations. Management believes this measure is useful because it enables management and investors to assess our underlying operating performance and cash available to fund our operations.
The following table reconciles adjusted noninterest income to noninterest income, the most directly comparable GAAP measure:
The following table reconciles adjusted noninterest income for the Lending segment to noninterest income, the most directly comparable GAAP measure for the Lending segment:
Adjusted Contribution Margin and Incremental Adjusted Contribution Margin — Lending
Adjusted contribution margin and incremental adjusted contribution margin are non-GAAP measures and relate only to our Lending segment. Adjusted contribution margin is defined as segment contribution profit for the Lending segment, divided by adjusted net revenue for the Lending segment, a non-GAAP measure. Incremental adjusted contribution margin is defined as the change in segment contribution profit for our Lending segment, divided by change in adjusted net revenue for the Lending segment. See ‘ Adjusted Net Revenue’ above for a reconciliation of Lending segment adjusted net revenue.
Management believes adjusted contribution margin metrics are useful because they enable management and investors to assess the underlying operating performance of our Lending segment, by removing the impact of changes in volume over periods to present a comparable view of segment contribution profit, which is a measure of the direct profitability of each of our reportable segments, as a percentage of segment adjusted net revenue for the Lending segment during each period.
The following table presents a reconciliation of adjusted contribution margin and incremental adjusted contribution margin for our reportable Lending segment:
Adjusted EBITDA, Adjusted EBITDA Margin and Incremental Adjusted EBITDA Margin
Adjusted EBITDA, adjusted EBITDA margin and incremental adjusted EBITDA margin are non-GAAP measures. Adjusted EBITDA is defined as net income, adjusted to exclude, as applicable: (i) corporate borrowing-based interest expense (our adjusted EBITDA measure is not adjusted for warehouse or securitization-based interest expense, nor deposit interest expense and finance lease liability interest expense, as these are direct operating expenses), (ii) income tax expense (benefit), (iii) depreciation and amortization, (iv) share-based expense (inclusive of equity-based payments to non-employees), (v) foreign currency impacts related to operations in highly inflationary countries, (vi) fair value changes in each of servicing rights and residual interests classified as debt due to valuation assumptions, (vii) restructuring charges, (viii) transaction-related expenses, and (ix) other charges, as appropriate, that are not expected to recur and are not indicative of our core operating performance.
Adjusted EBITDA margin is computed as adjusted EBITDA divided by adjusted net revenue. Incremental adjusted EBITDA margin is defined as the change in adjusted EBITDA, divided by change in adjusted net revenue. See ‘ Adjusted Net Revenue’ above for a reconciliation of this non-GAAP measure.
Management believes adjusted EBITDA, adjusted EBITDA margin and incremental adjusted EBITDA margin are useful measures for period-over-period comparisons of our business. These measures enable management and investors to assess our core operating performance or results of operations by removing the effects of certain non-cash items and charges, as well as the impact of changes in volume over periods as applicable. In addition, management uses these measures to help evaluate cash flows generated from operations and the extent of additional capital, if any, required to invest in strategic initiatives.
The following table reconciles adjusted EBITDA to net income, the most directly comparable GAAP measure, and presents the computations of adjusted EBITDA margin and incremental adjusted EBITDA margin:
Tangible Book Value and Tangible Book Value per Common Share
Tangible book value is defined as permanent equity, adjusted to exclude goodwill and intangible assets, net of related deferred tax liabilities. Tangible book value per common share represents tangible book value at period-end divided by common stock outstanding at period-end. Prior periods were revised to conform with this presentation.
These measures are utilized by management in assessing our use of equity and capital adequacy. We believe that tangible book value presents a meaningful measure of net asset value, and tangible book value per share provides additional useful information to investors to assess capital adequacy.
The following table reconciles tangible book value to permanent equity, the most directly comparable GAAP measure, and presents the computation of permanent equity per common share and tangible book value per common share for the periods presented:
Adjusted Net Income, Adjusted Net Income Margin, Incremental Adjusted Net Income Margin and Adjusted EPS
Adjusted net income, adjusted net income margin, incremental adjusted net income margin and adjusted diluted earnings per share are non-GAAP measures. Adjusted net income is defined as net income, adjusted to exclude, as applicable, transaction-related expense, restructuring charges, goodwill impairment expense and certain income tax benefits that are not expected to recur and are not indicative of our core operating performance.
Adjusted diluted earnings per share (“adjusted EPS”) is a non-GAAP financial measure that adjusts GAAP diluted earnings per share. Adjusted EPS is computed by dividing net income attributable to common stockholders, adjusted to exclude, as applicable, transaction-related expense, restructuring charges, goodwill impairment expense and certain income tax benefits that are not expected to recur and are not indicative of our core operating performance, by the diluted weighted average number of shares of common stock outstanding during the period, excluding the dilutive impact of the 2026 and 2029 convertible notes under the if-converted method for which the 2026 and 2029 capped call transactions, respectively, would deliver cash or shares to offset dilution. The exclusions of transaction-related expense and restructuring charges were effective beginning in the second quarter of 2026. The impact to prior periods was determined to be immaterial, and therefore prior periods were not recast.
Adjusted net income margin is computed as adjusted net income divided by adjusted net revenue. Incremental adjusted net income margin is defined as the change in adjusted net income, divided by change in adjusted net revenue. See ‘ Adjusted Net Revenue’ above for a reconciliation of this non-GAAP measure.
Management believes adjusted net income, adjusted net income margin, incremental adjusted net income margin and adjusted EPS are useful because they enable management and investors to assess our core operating performance or results of operations, by removing the effects of certain non cash items and charges to present a comparable view for period over period comparisons of our business.
The following table: (i) reconciles adjusted net income to net income, the most directly comparable GAAP measure, (ii) reconciles adjusted EPS to diluted earnings per share, the most directly comparable GAAP measure, and (iii) presents the computations of adjusted net income margin and incremental adjusted net income margin.
Members
We refer to our customers as “members”. We define a member as someone who has a lending relationship with us through origination and/or ongoing servicing, opened a financial services account, linked an external account to our platform, or signed up for our credit score monitoring service. Our members have access to our CFPs, our member events, our content, educational material, news, and our tools and calculators, which are provided at no cost to the member. We view members as an indication not only of the size and a measurement of growth of our business, but also as a measure of the significant value of the data we have collected over time.
Once someone becomes a member, they are always considered a member unless they are removed in accordance with our terms of service, in which case, we adjust our total number of members. This could occur for a variety of reasons—including fraud or pursuant to certain legal processes—and, as our terms of service evolve together with our business practices, product offerings and applicable regulations, our grounds for removing members from our total member count could change. The determination that a member should be removed in accordance with our terms of service is subject to an evaluation process, following the completion, and based on the results, of which, relevant members and their associated products are removed from our total member count in the period in which such evaluation process concludes. However, depending on the length of the evaluation process, that removal may not take place in the same period in which the member was added to our member count or the same period in which the circumstances leading to their removal occurred. For this reason, our total member count may not yet reflect adjustments that may be made once ongoing evaluation processes, if any, conclude. Beginning in the first quarter of 2024, we aligned our methodology for calculating member and product metrics with our member and product definitions to include co-borrowers, co-signers, and joint- and co-account holders, as applicable. Quarterly amounts for prior periods were determined to be immaterial and were not recast.
Total Products
Total products refers to the aggregate number of lending and financial services products that our members have selected on our platform since our inception through the reporting date, whether or not the members are still registered for such products. Total products is a primary indicator of the size and reach of our Lending and Financial Services segments. Management relies on total products metrics to understand the effectiveness of our member acquisition efforts and to gauge the propensity for members to use more than one product.
In our Lending segment, total products refers to the number of personal loans, student loans and home loans that have been originated through our platform through the reporting date, inclusive of loans which we originate as part of our Loan Platform Business, whether or not such loans have been paid off. If a member has multiple loan products of the same loan product type, such as two personal loans, that is counted as a single product. However, if a member has multiple loan products across loan product types, such as one personal loan and one home loan, that is counted as two products. The account of a co-borrower or co-signer is not considered a separate lending product.
In our Financial Services segment, total products refers to the number of SoFi Money accounts (inclusive of checking and savings accounts held at SoFi Bank and cash management accounts), SoFi Invest accounts, SoFi Credit Card accounts (including Smart Card accounts and accounts with a zero dollar balance at the reporting date), referred loans (which are originated by a third-party partner to which we provide pre-qualified borrower referrals), SoFi At Work accounts, SoFi Relay accounts (with either credit score monitoring enabled or external linked accounts), and SoFi Crypto accounts that have been opened through our platform through the reporting date, as well as active SoFi Plus subscriptions as of the reporting date. Checking and savings accounts are considered one account within our total products metric. Our SoFi Invest service is composed of four products: IRA self-directed accounts, taxable self-directed accounts, IRA robo-advisory accounts, and taxable robo-advisory accounts. Our members can select any one or combination of the SoFi Invest products. If a member has multiple SoFi Invest accounts of the same products, such as one IRA self-directed account and one IRA robo-advisory account (or one tax-advantaged brokerage account and one taxable brokerage account), those are considered separate products. The account of a joint- or co-account holder is considered a separate financial services product. In the event a member is removed in accordance with our terms of service, as discussed under “Members” above, the member’s associated products are also removed.
Technology Platform Total Accounts
In our Technology Platform segment, total accounts refers to the number of open accounts at Galileo as of the reporting date. We include intercompany accounts on the Galileo platform as a service in our total accounts metric to better align with the Technology Platform segment revenue which includes intercompany revenue. Intercompany revenue is eliminated in consolidation. Total accounts is a primary indicator of the accounts dependent upon our technology platform to use virtual card products, virtual wallets, make peer-to-peer and bank-to-bank transfers, receive early paychecks, separate savings from spending balances, make debit transactions and rely upon real-time authorizations, all of which result in revenues for the Technology Platform segment. We do not measure total accounts for other products and solutions for which the revenue model is not primarily dependent upon being a fully integrated, stand-ready service.
Note: For additional information on our company metrics, including the definitions of "Members", "Total Products" and "Technology Platform Total Accounts", see Table 6 in the “Financial Tables” herein. New member and new product addition metrics for the relevant period reflect actual growth or declines in members and products that occurred in that period whereas the total number of members and products reflects not only the growth or decline of each metric in the current period but also additions or deletions due to prior period factors, if any. (1) The company includes SoFi accounts on the SoFi Tech Solutions platform-as-a-service in its total Technology Platform accounts metric to better align with the presentation of Technology Platform segment revenue.